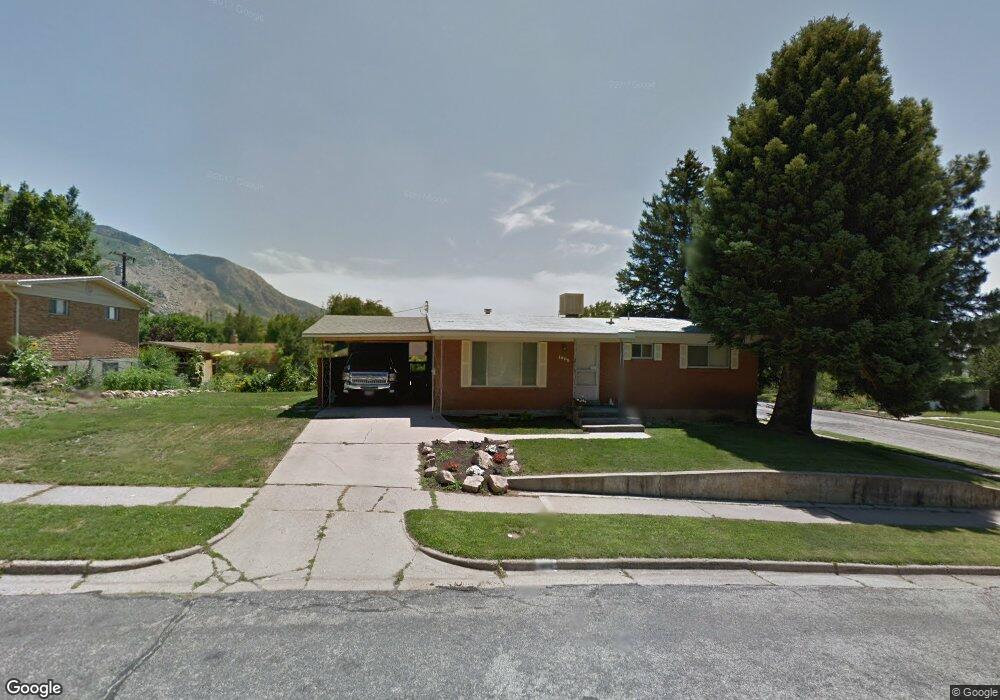
1605 11th St Ogden, UT 84404
Horace Mann NeighborhoodEstimated Value: $405,000 - $437,000
5
Beds
2
Baths
1,148
Sq Ft
$362/Sq Ft
Est. Value
About This Home
This home is located at 1605 11th St, Ogden, UT 84404 and is currently estimated at $416,137, approximately $362 per square foot. 1605 11th St is a home located in Weber County with nearby schools including Mound Fort Junior High School and Ben Lomond High School.
Ownership History
Date
Name
Owned For
Owner Type
Purchase Details
Closed on
Mar 19, 2025
Sold by
Milligan Bud J
Bought by
Milligan Bud
Current Estimated Value
Home Financials for this Owner
Home Financials are based on the most recent Mortgage that was taken out on this home.
Original Mortgage
$138,000
Outstanding Balance
$137,296
Interest Rate
6.89%
Mortgage Type
Credit Line Revolving
Estimated Equity
$278,841
Purchase Details
Closed on
Mar 2, 2005
Sold by
Taylor Lavall H and Taylor Gloria D
Bought by
Milligan Buddy J and Milligan Bud J
Home Financials for this Owner
Home Financials are based on the most recent Mortgage that was taken out on this home.
Original Mortgage
$115,684
Interest Rate
5.66%
Mortgage Type
FHA
Create a Home Valuation Report for This Property
The Home Valuation Report is an in-depth analysis detailing your home's value as well as a comparison with similar homes in the area
Home Values in the Area
Average Home Value in this Area
Purchase History
| Date | Buyer | Sale Price | Title Company |
|---|---|---|---|
| Milligan Bud | -- | Freedom Title Insurance Agency | |
| Milligan Buddy J | -- | First American Title |
Source: Public Records
Mortgage History
| Date | Status | Borrower | Loan Amount |
|---|---|---|---|
| Open | Milligan Bud | $138,000 | |
| Previous Owner | Milligan Buddy J | $115,684 |
Source: Public Records
Tax History
| Year | Tax Paid | Tax Assessment Tax Assessment Total Assessment is a certain percentage of the fair market value that is determined by local assessors to be the total taxable value of land and additions on the property. | Land | Improvement |
|---|---|---|---|---|
| 2025 | $2,993 | $402,478 | $122,730 | $279,748 |
| 2024 | $2,867 | $210,099 | $67,504 | $142,595 |
| 2023 | $2,817 | $209,000 | $67,816 | $141,184 |
| 2022 | $2,973 | $223,300 | $54,281 | $169,019 |
| 2021 | $2,301 | $282,000 | $63,772 | $218,228 |
| 2020 | $2,179 | $246,000 | $48,940 | $197,060 |
| 2019 | $2,180 | $231,000 | $44,058 | $186,942 |
| 2018 | $1,875 | $195,000 | $44,058 | $150,942 |
| 2017 | $1,628 | $156,000 | $39,180 | $116,820 |
| 2016 | $1,492 | $76,690 | $18,840 | $57,850 |
| 2015 | $1,399 | $70,597 | $18,840 | $51,757 |
| 2014 | $1,311 | $64,793 | $16,167 | $48,626 |
Source: Public Records
Map
Nearby Homes
- 1528 Sunview Dr
- 1565 E 775 S Unit 7
- 1522 Robins Cir
- 572 S Elena Ln
- 1372 Millcreek Dr Unit 8
- 1346 Millcreek Dr Unit 6
- 1568 Hudson St Unit 1
- 1534 Tyler Ave
- 1582 E Maddies Cove Unit 19
- 1281 16th St
- 1175 Canyon Rd Unit 80
- 1175 Canyon Rd Unit 81
- 1277 16th St
- 1273 16th St
- 3270 N 3325 W Unit 386B
- 1435 S 1195 E Unit 19
- 1120 Canyon Rd Unit 38
- 1120 Canyon Rd Unit 28
- 1120 Canyon Rd Unit 16
- 1243 Hudson St