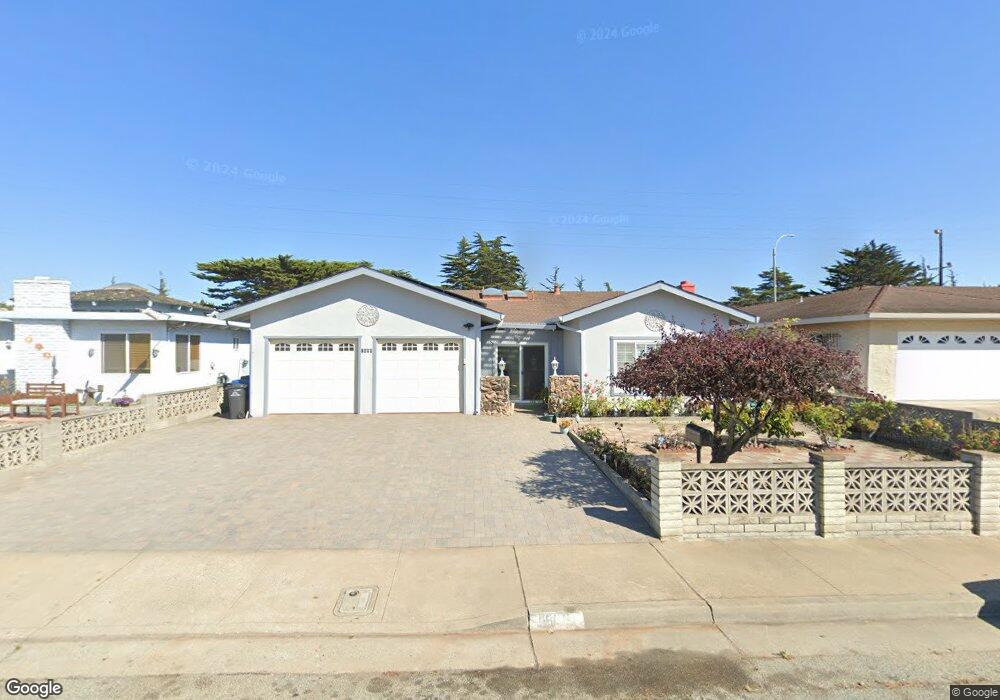
1606 Mescal St Seaside, CA 93955
Estimated Value: $887,534 - $918,000
4
Beds
2
Baths
1,960
Sq Ft
$460/Sq Ft
Est. Value
About This Home
This home is located at 1606 Mescal St, Seaside, CA 93955 and is currently estimated at $902,384, approximately $460 per square foot. 1606 Mescal St is a home located in Monterey County with nearby schools including Martin Luther King, Seaside Middle School, and Seaside High School.
Ownership History
Date
Name
Owned For
Owner Type
Purchase Details
Closed on
Jun 12, 2009
Sold by
Constantino Romeo H and Constantino Eu Frocina I
Bought by
Constantino Romeo H and Constantino Eu Frocina I
Current Estimated Value
Home Financials for this Owner
Home Financials are based on the most recent Mortgage that was taken out on this home.
Original Mortgage
$176,000
Interest Rate
4.82%
Mortgage Type
New Conventional
Purchase Details
Closed on
Jul 20, 2005
Sold by
Constantino Romeo H and Constantino Eufrocina I
Bought by
Constantino Romeo H and Constantino Eufrocina I
Purchase Details
Closed on
Mar 19, 2003
Sold by
Constantino Romeo H and Constantino Eufrocina I
Bought by
Constantino Romeo H and Constantino Eufrocina I
Create a Home Valuation Report for This Property
The Home Valuation Report is an in-depth analysis detailing your home's value as well as a comparison with similar homes in the area
Home Values in the Area
Average Home Value in this Area
Purchase History
| Date | Buyer | Sale Price | Title Company |
|---|---|---|---|
| Constantino Romeo H | -- | Accommodation | |
| Constantino Romeo H | -- | First American Title Company | |
| Constantino Romeo H | -- | -- | |
| Constantino Romeo H | -- | -- |
Source: Public Records
Mortgage History
| Date | Status | Borrower | Loan Amount |
|---|---|---|---|
| Closed | Constantino Romeo H | $176,000 |
Source: Public Records
Tax History
| Year | Tax Paid | Tax Assessment Tax Assessment Total Assessment is a certain percentage of the fair market value that is determined by local assessors to be the total taxable value of land and additions on the property. | Land | Improvement |
|---|---|---|---|---|
| 2025 | $2,106 | $203,126 | $36,594 | $166,532 |
| 2024 | $2,106 | $199,144 | $35,877 | $163,267 |
| 2023 | $2,083 | $195,240 | $35,174 | $160,066 |
| 2022 | $2,052 | $191,413 | $34,485 | $156,928 |
| 2021 | $2,021 | $187,660 | $33,809 | $153,851 |
| 2020 | $1,944 | $185,737 | $33,463 | $152,274 |
| 2019 | $2,035 | $182,096 | $32,807 | $149,289 |
| 2018 | $1,954 | $178,526 | $32,164 | $146,362 |
| 2017 | $1,809 | $175,027 | $31,534 | $143,493 |
| 2016 | $1,775 | $171,596 | $30,916 | $140,680 |
| 2015 | $1,749 | $169,019 | $30,452 | $138,567 |
| 2014 | $1,718 | $165,709 | $29,856 | $135,853 |
Source: Public Records
Map
Nearby Homes
- 1580 Ancon St
- 1732 Fernando St
- 1790 Fernando St
- 1610 Soto St
- 1688 Harding St
- 1184 Barbara Ct
- 1809 Vallejo St
- 1313 Harding St
- 1330 Flores St
- 1659 Judson St
- 1169 Yosemite St
- 1740 Judson St
- 1516 Hilby Ave
- 1714 Luxton St
- 2080 Buchanan St
- 1666 Hilton St
- 1355 La Salle Ave
- 1135 Madera Ct
- 1224 Trinity Ave Unit 14
- 1986 Luxton St
- 1612 Mescal St
- 1600 Mescal St
- 1618 Mescal St
- 1624 Mescal St
- 1605 Mescal St
- 1623 Mescal St
- 1598 Mescal St
- 1630 Mescal St
- 1609 Marietta St
- 1797 Broadway Ave
- 1633 Mescal St
- 1606 Marietta St
- 1590 Mescal St
- 9 Balfour Ct
- 1613 Marietta St
- 1595 Mescal St
- 1781 Broadway Ave
- 1643 Mescal St
- 1612 Marietta St
- 1580 Mescal St
Your Personal Tour Guide
Ask me questions while you tour the home.