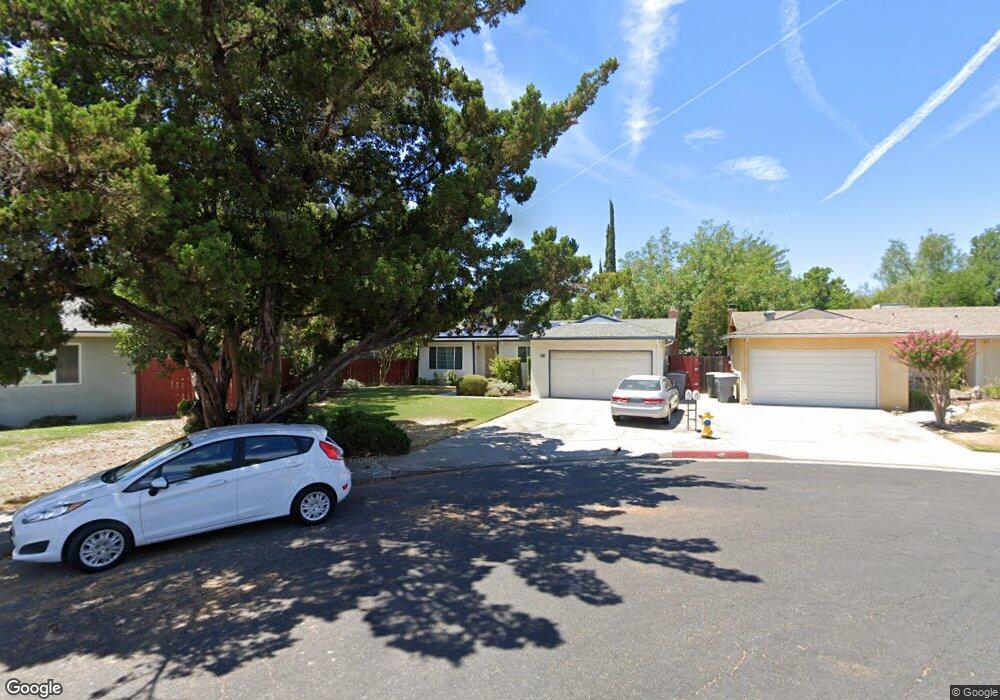
1606 Scott Place Clovis, CA 93611
Estimated Value: $370,103 - $391,000
3
Beds
2
Baths
1,427
Sq Ft
$269/Sq Ft
Est. Value
About This Home
This home is located at 1606 Scott Place, Clovis, CA 93611 and is currently estimated at $384,034, approximately $269 per square foot. 1606 Scott Place is a home located in Fresno County with nearby schools including Jefferson Elementary School, Clark Intermediate School, and Clovis High School.
Ownership History
Date
Name
Owned For
Owner Type
Purchase Details
Closed on
Dec 14, 2000
Sold by
Steven Gallegos
Bought by
Sullivan Michael Max and Sullivan Amy Christine
Current Estimated Value
Home Financials for this Owner
Home Financials are based on the most recent Mortgage that was taken out on this home.
Original Mortgage
$99,065
Outstanding Balance
$35,430
Interest Rate
7.65%
Estimated Equity
$348,604
Purchase Details
Closed on
Sep 24, 1997
Sold by
Gallegos Rosemarie A and Gallegos Rosemarie A
Bought by
Gallegos Steven
Home Financials for this Owner
Home Financials are based on the most recent Mortgage that was taken out on this home.
Original Mortgage
$86,700
Interest Rate
7.07%
Mortgage Type
VA
Purchase Details
Closed on
Sep 23, 1997
Sold by
Steven Gallegos
Bought by
Gallegos Rosemarie A
Home Financials for this Owner
Home Financials are based on the most recent Mortgage that was taken out on this home.
Original Mortgage
$86,700
Interest Rate
7.07%
Mortgage Type
VA
Create a Home Valuation Report for This Property
The Home Valuation Report is an in-depth analysis detailing your home's value as well as a comparison with similar homes in the area
Home Values in the Area
Average Home Value in this Area
Purchase History
| Date | Buyer | Sale Price | Title Company |
|---|---|---|---|
| Sullivan Michael Max | $100,000 | North American Title Co | |
| Gallegos Steven | $85,000 | Landmark Title Company | |
| Gallegos Rosemarie A | -- | -- |
Source: Public Records
Mortgage History
| Date | Status | Borrower | Loan Amount |
|---|---|---|---|
| Open | Sullivan Michael Max | $99,065 | |
| Previous Owner | Gallegos Steven | $86,700 |
Source: Public Records
Tax History
| Year | Tax Paid | Tax Assessment Tax Assessment Total Assessment is a certain percentage of the fair market value that is determined by local assessors to be the total taxable value of land and additions on the property. | Land | Improvement |
|---|---|---|---|---|
| 2025 | $1,709 | $150,656 | $45,191 | $105,465 |
| 2023 | $1,642 | $144,808 | $43,437 | $101,371 |
| 2022 | $1,618 | $141,970 | $42,586 | $99,384 |
| 2021 | $1,572 | $139,187 | $41,751 | $97,436 |
| 2020 | $1,565 | $137,760 | $41,323 | $96,437 |
| 2019 | $1,533 | $135,060 | $40,513 | $94,547 |
| 2018 | $1,498 | $132,413 | $39,719 | $92,694 |
| 2017 | $1,471 | $129,818 | $38,941 | $90,877 |
| 2016 | $1,420 | $127,274 | $38,178 | $89,096 |
| 2015 | $1,398 | $125,363 | $37,605 | $87,758 |
| 2014 | $1,371 | $122,908 | $36,869 | $86,039 |
Source: Public Records
Map
Nearby Homes
- 1515 Keats Ave
- 1428 Miami Ave
- 1622 Dennis Ave
- 1606 Barstow Ave
- 1721 Beverly Ave
- 1273 Bundy Ave
- 1334 Shirley Ave
- 2214 Fordham Ave
- 1228 Jefferson Ave
- 2306 Stanford Ave
- 1488 Alamos Ave
- 1584 Laverne Ave
- 1876 Cougar Ln
- 3497 Shaw Ave
- 1895 Dennis Ave
- 760 Sunnyside Ave
- 860 Mcarthur Ave
- 2627 Stanford Ave
- 2523 Legacy Dr
- 1555 Pico Ave
- 1602 Scott Place
- 1605 Scott Ct
- 1614 Scott Place
- 1615 Scott Ct
- 1524 Beverly Ave
- 1534 Beverly Ave
- 1601 Scott Ct
- 1601 Scott Place
- 1624 Scott Place
- 1514 Beverly Ave
- 1544 Beverly Ave
- 1625 Scott Ct
- 1502 Beverly Ave
- 1615 Scott Place
- 1556 Beverly Ave
- 1634 Scott Place
- 1602 Scott Ct
- 1625 Scott Place
- 1635 Scott Ct
- 1496 Beverly Ave
Your Personal Tour Guide
Ask me questions while you tour the home.