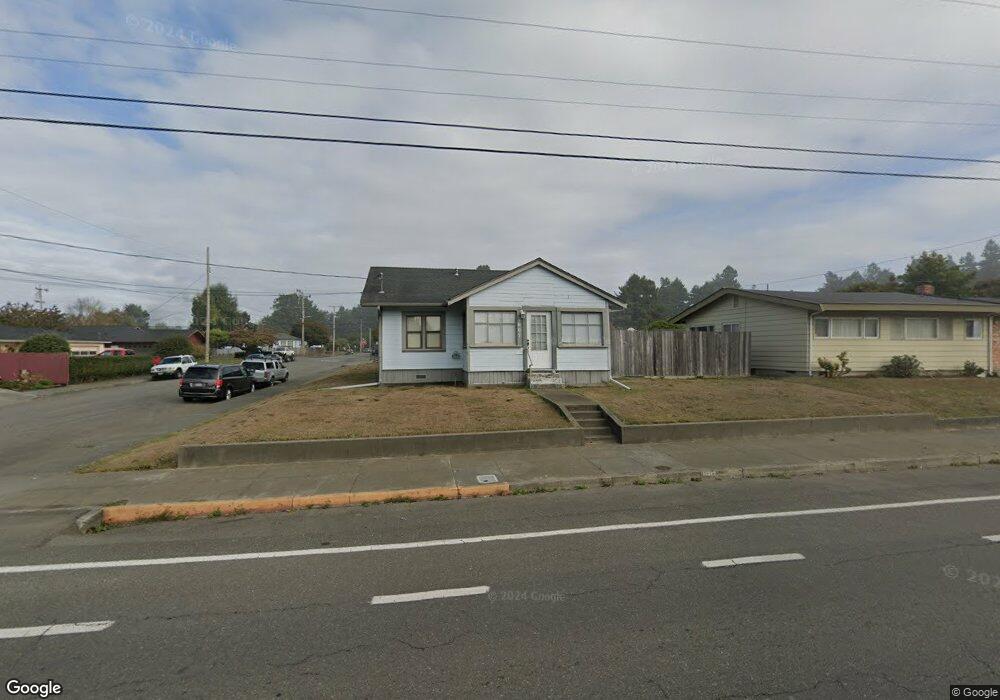
1607 Harris St Eureka, CA 95503
Buhne Street-Harrison Avenue NeighborhoodEstimated Value: $346,000 - $417,782
2
Beds
1
Bath
868
Sq Ft
$436/Sq Ft
Est. Value
About This Home
This home is located at 1607 Harris St, Eureka, CA 95503 and is currently estimated at $378,196, approximately $435 per square foot. 1607 Harris St is a home located in Humboldt County with nearby schools including Washington Elementary School, Catherine L. Zane Middle School, and Eureka Senior High School.
Ownership History
Date
Name
Owned For
Owner Type
Purchase Details
Closed on
May 24, 2005
Sold by
Rose Richard Leroy and Rose Charlotte M
Bought by
Sims Wayne and Sims Tomala
Current Estimated Value
Home Financials for this Owner
Home Financials are based on the most recent Mortgage that was taken out on this home.
Original Mortgage
$184,000
Outstanding Balance
$89,141
Interest Rate
4.75%
Mortgage Type
New Conventional
Estimated Equity
$289,055
Create a Home Valuation Report for This Property
The Home Valuation Report is an in-depth analysis detailing your home's value as well as a comparison with similar homes in the area
Home Values in the Area
Average Home Value in this Area
Purchase History
| Date | Buyer | Sale Price | Title Company |
|---|---|---|---|
| Sims Wayne | $230,000 | First American Title Ins Co |
Source: Public Records
Mortgage History
| Date | Status | Borrower | Loan Amount |
|---|---|---|---|
| Open | Sims Wayne | $184,000 |
Source: Public Records
Tax History
| Year | Tax Paid | Tax Assessment Tax Assessment Total Assessment is a certain percentage of the fair market value that is determined by local assessors to be the total taxable value of land and additions on the property. | Land | Improvement |
|---|---|---|---|---|
| 2025 | $3,642 | $361,302 | $139,378 | $221,924 |
| 2024 | $3,642 | $354,219 | $136,646 | $217,573 |
| 2023 | $3,590 | $347,274 | $133,967 | $213,307 |
| 2022 | $3,725 | $340,466 | $131,341 | $209,125 |
| 2021 | $3,487 | $333,791 | $128,766 | $205,025 |
| 2020 | $3,460 | $330,369 | $127,446 | $202,923 |
| 2019 | $3,388 | $323,893 | $124,948 | $198,945 |
| 2018 | $3,335 | $317,544 | $122,499 | $195,045 |
| 2017 | $3,317 | $311,319 | $120,098 | $191,221 |
| 2016 | $3,316 | $305,216 | $117,744 | $187,472 |
| 2015 | $3,286 | $300,632 | $115,976 | $184,656 |
| 2014 | $3,070 | $294,744 | $113,705 | $181,039 |
Source: Public Records
Map
Nearby Homes
Your Personal Tour Guide
Ask me questions while you tour the home.