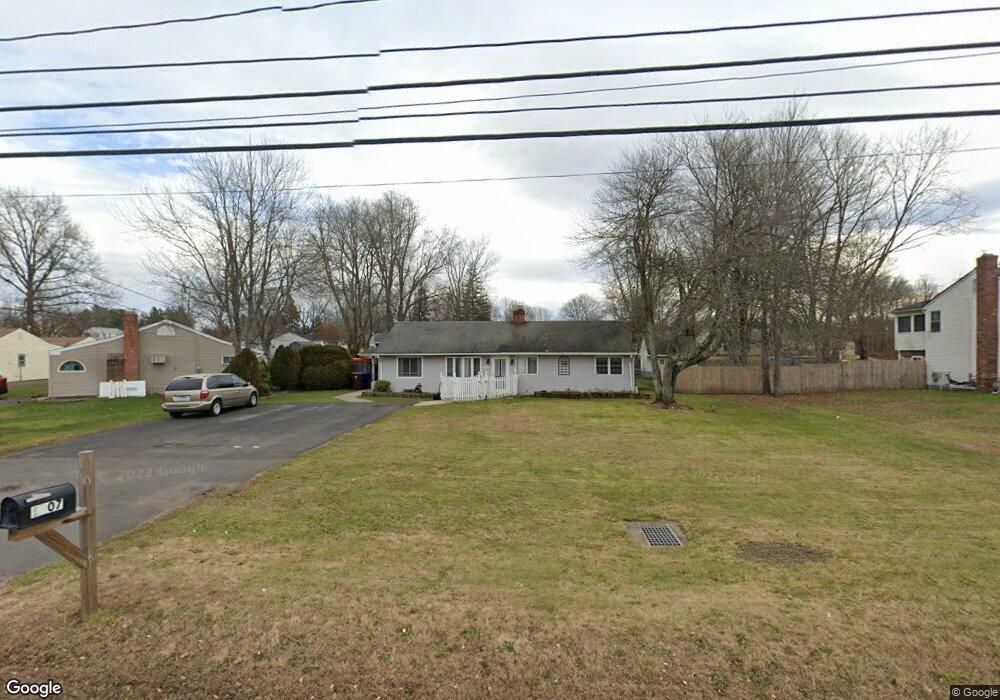
1607 King St Enfield, CT 06082
Estimated Value: $262,000 - $321,000
3
Beds
1
Bath
1,320
Sq Ft
$216/Sq Ft
Est. Value
About This Home
This home is located at 1607 King St, Enfield, CT 06082 and is currently estimated at $284,592, approximately $215 per square foot. 1607 King St is a home located in Hartford County with nearby schools including Edgar H. Parkman School, Enfield Street Elementary School, and John F. Kennedy Middle School.
Ownership History
Date
Name
Owned For
Owner Type
Purchase Details
Closed on
Jul 15, 2021
Sold by
Keating Joyce M
Bought by
Joyce M Keating Ret
Current Estimated Value
Purchase Details
Closed on
Jul 25, 2007
Sold by
Mcgrath Ruth
Bought by
Galbraith Glen and Galbraith Olga
Home Financials for this Owner
Home Financials are based on the most recent Mortgage that was taken out on this home.
Original Mortgage
$172,633
Interest Rate
6.78%
Mortgage Type
VA
Purchase Details
Closed on
Nov 5, 2001
Sold by
Leitao Valerie
Bought by
Tyrcell Ruth
Purchase Details
Closed on
Jun 26, 1998
Sold by
Grillo Lisa
Bought by
Leitao Valerie
Purchase Details
Closed on
Jul 21, 1993
Sold by
Keating Joyce
Bought by
Grillo Lisa
Purchase Details
Closed on
Jan 29, 1993
Sold by
Abell Brenda
Bought by
Keating Joyce
Create a Home Valuation Report for This Property
The Home Valuation Report is an in-depth analysis detailing your home's value as well as a comparison with similar homes in the area
Home Values in the Area
Average Home Value in this Area
Purchase History
| Date | Buyer | Sale Price | Title Company |
|---|---|---|---|
| Joyce M Keating Ret | -- | None Available | |
| Galbraith Glen | $169,000 | -- | |
| Tyrcell Ruth | $115,900 | -- | |
| Leitao Valerie | $99,000 | -- | |
| Grillo Lisa | $87,000 | -- | |
| Keating Joyce | $62,000 | -- | |
| Galbraith Glen | $169,000 | -- | |
| Tyrcell Ruth | $115,900 | -- | |
| Leitao Valerie | $99,000 | -- | |
| Grillo Lisa | $87,000 | -- | |
| Keating Joyce | $62,000 | -- |
Source: Public Records
Mortgage History
| Date | Status | Borrower | Loan Amount |
|---|---|---|---|
| Previous Owner | Keating Joyce | $172,633 |
Source: Public Records
Tax History Compared to Growth
Tax History
| Year | Tax Paid | Tax Assessment Tax Assessment Total Assessment is a certain percentage of the fair market value that is determined by local assessors to be the total taxable value of land and additions on the property. | Land | Improvement |
|---|---|---|---|---|
| 2025 | $4,258 | $121,700 | $45,800 | $75,900 |
| 2024 | $4,144 | $121,700 | $45,800 | $75,900 |
| 2023 | $4,113 | $121,700 | $45,800 | $75,900 |
| 2022 | $3,735 | $121,700 | $45,800 | $75,900 |
| 2021 | $3,565 | $94,980 | $37,940 | $57,040 |
| 2020 | $3,565 | $94,980 | $37,940 | $57,040 |
| 2019 | $3,574 | $94,980 | $37,940 | $57,040 |
| 2018 | $3,514 | $94,980 | $37,940 | $57,040 |
| 2017 | $3,318 | $94,980 | $37,940 | $57,040 |
| 2016 | $3,339 | $97,320 | $41,730 | $55,590 |
| 2015 | $3,235 | $97,320 | $41,730 | $55,590 |
| 2014 | $3,151 | $97,320 | $41,730 | $55,590 |
Source: Public Records
Map
Nearby Homes
- 0 Mullen Rd
- 1561 King St
- 21 King Ct
- 45 King Ct
- 1527 King St
- 32 Pleasant Rd
- 13 Plainfield St
- 17 Plainfield St
- 86 Weymouth Rd
- 9 North Rd Unit 17
- 660 East St S
- 92 Post Office Rd
- 14 Seymour Rd
- 3 Green Briar Dr Unit 3
- 18 Hudson St
- 143 Bridge St
- 0 N Water St Unit 24138494
- 0 N Water St Unit 24128295
- 0 N Water St Unit 24128294
- 0 N Water St Unit 24128288