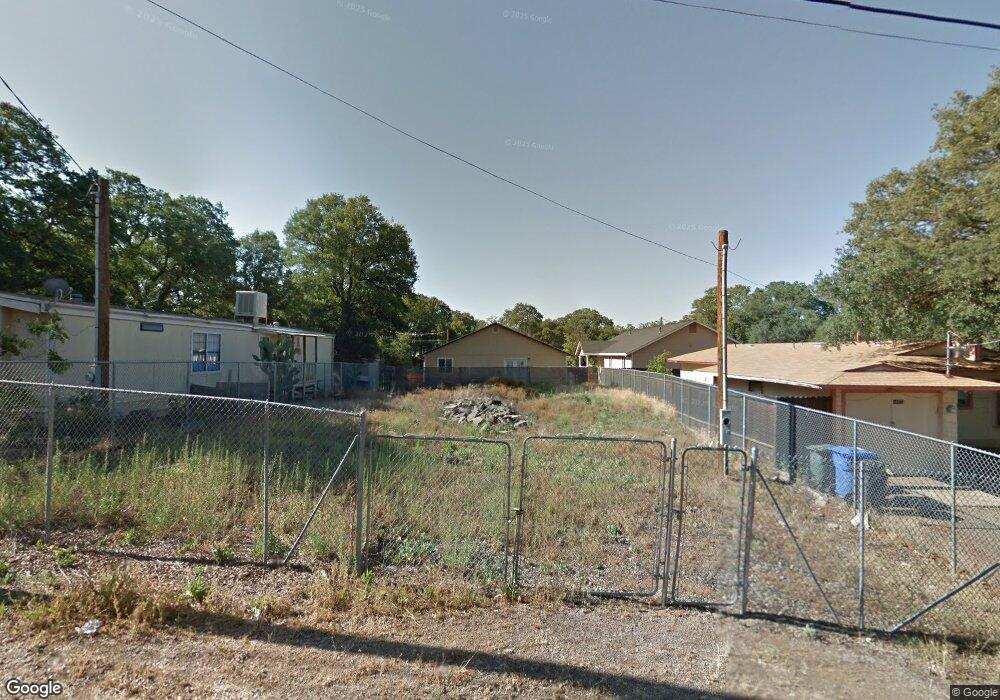
16083 28th Ave Clear Lake, CA 95422
Estimated Value: $137,000
--
Bed
--
Bath
1,100
Sq Ft
$125/Sq Ft
Est. Value
About This Home
This home is located at 16083 28th Ave, Clear Lake, CA 95422 and is currently estimated at $137,000, approximately $124 per square foot. 16083 28th Ave is a home located in Lake County with nearby schools including Lower Lake High School and Jeannies Learning Garden.
Ownership History
Date
Name
Owned For
Owner Type
Purchase Details
Closed on
Oct 2, 2018
Sold by
Negrete Jose Luis and Negrete Jenni Garcia De
Bought by
Negrete Jose Luis
Current Estimated Value
Purchase Details
Closed on
Aug 29, 2017
Sold by
Trade Maria Aricelda Noyola
Bought by
Negrete Jose Luis
Purchase Details
Closed on
Jun 30, 2011
Sold by
Trade Chris A
Bought by
Trade Maria Aricelda Noyola
Purchase Details
Closed on
Nov 19, 2006
Sold by
Delara Erasmo C and De Lara Alicia C
Bought by
Delara Alicia C
Create a Home Valuation Report for This Property
The Home Valuation Report is an in-depth analysis detailing your home's value as well as a comparison with similar homes in the area
Home Values in the Area
Average Home Value in this Area
Purchase History
| Date | Buyer | Sale Price | Title Company |
|---|---|---|---|
| Negrete Jose Luis | -- | None Available | |
| Negrete Jose Luis | $18,000 | None Available | |
| Trade Maria Aricelda Noyola | -- | None Available | |
| Trade Maria Aricelda Noyola | $1,500 | None Available | |
| Delara Alicia C | -- | None Available |
Source: Public Records
Tax History Compared to Growth
Tax History
| Year | Tax Paid | Tax Assessment Tax Assessment Total Assessment is a certain percentage of the fair market value that is determined by local assessors to be the total taxable value of land and additions on the property. | Land | Improvement |
|---|---|---|---|---|
| 2025 | $352 | $20,476 | $11,376 | $9,100 |
| 2024 | $352 | $20,075 | $11,153 | $8,922 |
| 2023 | $348 | $19,683 | $10,935 | $8,748 |
| 2022 | $334 | $19,298 | $10,721 | $8,577 |
| 2021 | $338 | $18,920 | $10,511 | $8,409 |
| 2020 | $336 | $18,727 | $10,404 | $8,323 |
| 2019 | $326 | $18,360 | $10,200 | $8,160 |
| 2018 | $325 | $18,000 | $10,000 | $8,000 |
| 2017 | $347 | $13,525 | $10,821 | $2,704 |
| 2016 | $280 | $13,260 | $10,609 | $2,651 |
| 2015 | $237 | $13,062 | $10,450 | $2,612 |
| 2014 | $234 | $12,807 | $10,246 | $2,561 |
Source: Public Records
Map
Nearby Homes