Estimated Value: $553,000 - $633,000
3
Beds
3
Baths
2,102
Sq Ft
$277/Sq Ft
Est. Value
About This Home
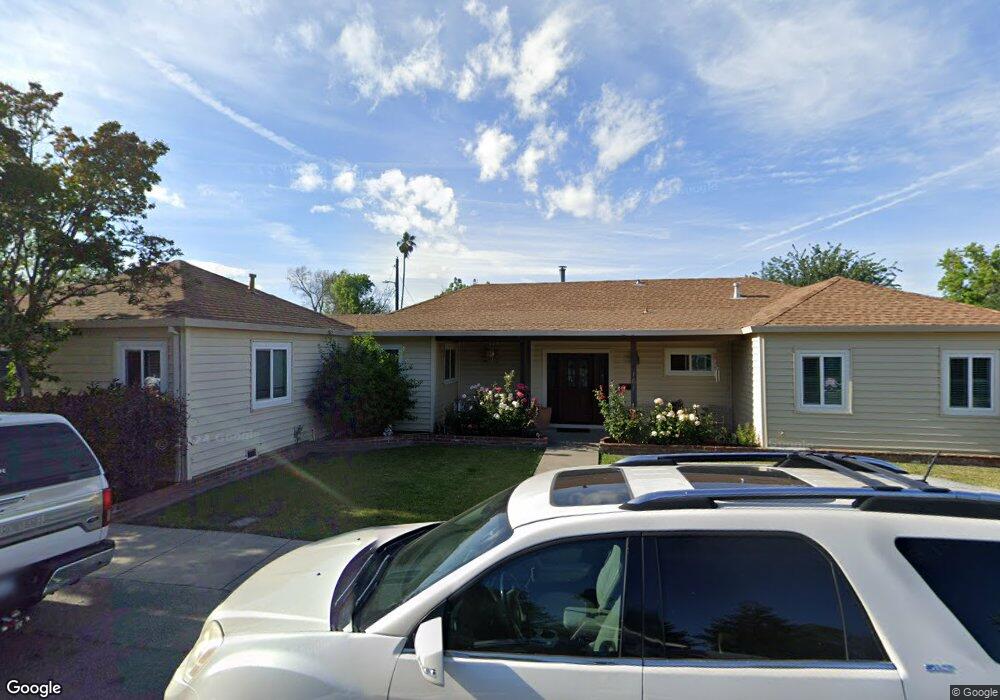
This home is located at 161 E Chestnut St, Dixon, CA 95620 and is currently estimated at $582,787, approximately $277 per square foot. 161 E Chestnut St is a home located in Solano County with nearby schools including Anderson (Linford L.) Elementary School, Dixon High School, and Dixon Montessori Charter.
Ownership History
Date
Name
Owned For
Owner Type
Purchase Details
Closed on
Sep 3, 2019
Sold by
Barrett Leisa M and Miller Leisa M
Bought by
Barrett Leisa M and Hamilton Michael L
Current Estimated Value
Home Financials for this Owner
Home Financials are based on the most recent Mortgage that was taken out on this home.
Original Mortgage
$220,000
Interest Rate
3.27%
Mortgage Type
Adjustable Rate Mortgage/ARM
Purchase Details
Closed on
Feb 20, 2008
Sold by
Miller Leisa M
Bought by
Miller Leisa M
Home Financials for this Owner
Home Financials are based on the most recent Mortgage that was taken out on this home.
Original Mortgage
$150,000
Interest Rate
5.42%
Mortgage Type
New Conventional
Purchase Details
Closed on
Aug 19, 2002
Sold by
Miller Monte L
Bought by
Miller Leisa M
Home Financials for this Owner
Home Financials are based on the most recent Mortgage that was taken out on this home.
Original Mortgage
$166,000
Interest Rate
5.84%
Mortgage Type
Negative Amortization
Create a Home Valuation Report for This Property
The Home Valuation Report is an in-depth analysis detailing your home's value as well as a comparison with similar homes in the area
Home Values in the Area
Average Home Value in this Area
Purchase History
| Date | Buyer | Sale Price | Title Company |
|---|---|---|---|
| Barrett Leisa M | -- | Fidelity Title Co Syn | |
| Miller Leisa M | -- | Placer Title Company | |
| Miller Leisa M | -- | Alliance Title Company |
Source: Public Records
Mortgage History
| Date | Status | Borrower | Loan Amount |
|---|---|---|---|
| Closed | Barrett Leisa M | $220,000 | |
| Closed | Miller Leisa M | $150,000 | |
| Closed | Miller Leisa M | $166,000 |
Source: Public Records
Tax History
| Year | Tax Paid | Tax Assessment Tax Assessment Total Assessment is a certain percentage of the fair market value that is determined by local assessors to be the total taxable value of land and additions on the property. | Land | Improvement |
|---|---|---|---|---|
| 2025 | $3,703 | $340,900 | $117,237 | $223,663 |
| 2024 | $3,703 | $334,217 | $114,939 | $219,278 |
| 2023 | $3,591 | $327,665 | $112,686 | $214,979 |
| 2022 | $3,538 | $321,241 | $110,478 | $210,763 |
| 2021 | $3,493 | $314,943 | $108,312 | $206,631 |
| 2020 | $3,436 | $311,715 | $107,202 | $204,513 |
| 2019 | $6,229 | $305,603 | $105,100 | $200,503 |
| 2018 | $6,210 | $299,612 | $103,040 | $196,572 |
| 2017 | $6,105 | $293,738 | $101,020 | $192,718 |
| 2016 | $3,125 | $287,980 | $99,040 | $188,940 |
| 2015 | $3,052 | $283,655 | $97,553 | $186,102 |
| 2014 | $3,019 | $278,100 | $95,643 | $182,457 |
Source: Public Records
Map
Nearby Homes
- 225 E Chestnut St
- 241 S 1st St
- 745 Jasmine St
- 1200 Tufts Ln
- 1130 Legion Ct
- 950 Norton Ct
- 689 W C St
- 625 Cypress St
- 650 W C St
- 1241 Valley Glen Dr
- 1215 Columbia Dr
- 620 N 2nd St
- 450 Priddy Dr
- 1245 Pacific Place
- 1325 Valley Glen Dr
- 550 W Creekside Cir
- 1535 Arlington Ct
- 10 Solano Dr
- 970 Camelia Dr
- 610 Sierra Dr
- 185 E Chestnut St
- 160 E Walnut St
- 205 E Chestnut St
- 461 S 1st St
- 481 S 1st St
- 180 E Walnut St
- 431 S 1st St
- 200 E Walnut St
- 215 E Chestnut St
- 411 S 1st St
- 200 E Chestnut St
- 210 E Walnut St
- 210 E Chestnut St
- 220 E Walnut St
- 391 S 1st St
- 220 E Chestnut St
- 370 S 2nd St
- 430 S 1st St
- 420 S 1st St
- 230 E Chestnut St
Your Personal Tour Guide
Ask me questions while you tour the home.