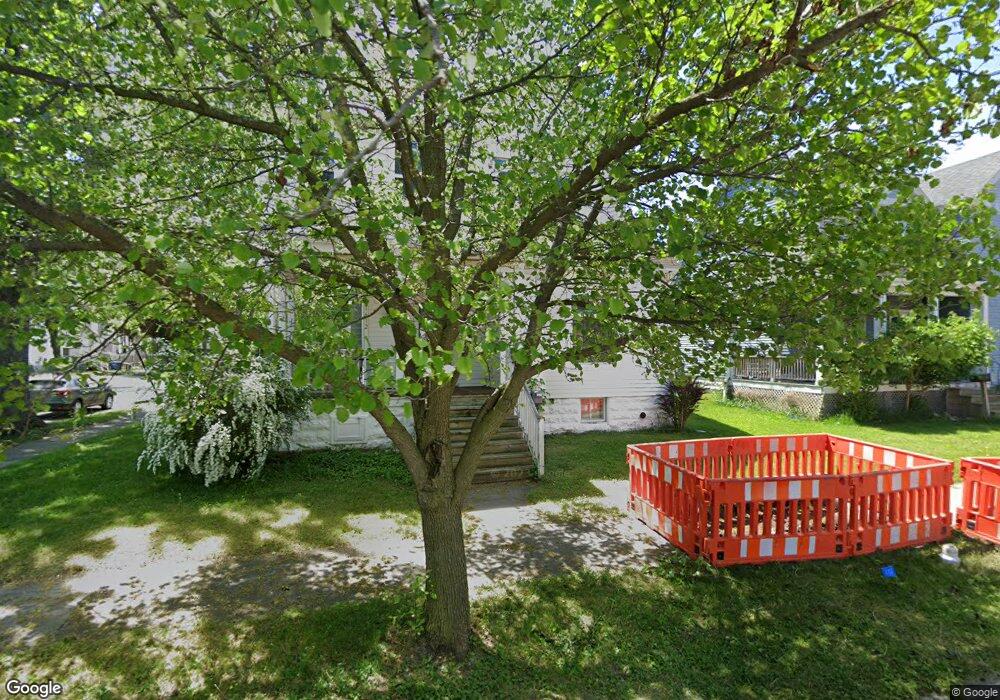
1612 9th St Bay City, MI 48708
Estimated Value: $143,170 - $172,000
5
Beds
2
Baths
1,592
Sq Ft
$98/Sq Ft
Est. Value
About This Home
This home is located at 1612 9th St, Bay City, MI 48708 and is currently estimated at $155,293, approximately $97 per square foot. 1612 9th St is a home located in Bay County with nearby schools including Washington Elementary School, Handy Middle School, and Bay City Central High School.
Ownership History
Date
Name
Owned For
Owner Type
Purchase Details
Closed on
Jul 11, 2025
Sold by
Aguirre Minnie and Aguirre Eluterio
Bought by
Aguirre Christie Rae
Current Estimated Value
Purchase Details
Closed on
Dec 18, 2014
Sold by
Aguirre Minnie
Bought by
Aguirre Minnie and Aguirre Eluterio
Purchase Details
Closed on
Jul 8, 2014
Sold by
Aguirre Eluterio and Aguirre Sherry
Bought by
Aguirre Minnie
Purchase Details
Closed on
Jan 1, 1991
Sold by
Hacker Boyd I and Hacker Kimberly A
Bought by
Aguirre Eluterio and Aguirre Sherry A
Create a Home Valuation Report for This Property
The Home Valuation Report is an in-depth analysis detailing your home's value as well as a comparison with similar homes in the area
Home Values in the Area
Average Home Value in this Area
Purchase History
| Date | Buyer | Sale Price | Title Company |
|---|---|---|---|
| Aguirre Christie Rae | -- | None Listed On Document | |
| Aguirre Minnie | -- | None Available | |
| Aguirre Minnie | -- | None Available | |
| Aguirre Eluterio | $39,500 | -- |
Source: Public Records
Tax History Compared to Growth
Tax History
| Year | Tax Paid | Tax Assessment Tax Assessment Total Assessment is a certain percentage of the fair market value that is determined by local assessors to be the total taxable value of land and additions on the property. | Land | Improvement |
|---|---|---|---|---|
| 2025 | $2,201 | $70,550 | $0 | $0 |
| 2024 | $1,812 | $62,750 | $0 | $0 |
| 2023 | $1,725 | $54,900 | $0 | $0 |
| 2022 | $1,981 | $49,500 | $0 | $0 |
| 2021 | $1,863 | $46,400 | $46,400 | $0 |
| 2020 | $1,981 | $43,350 | $43,350 | $0 |
| 2019 | $1,938 | $42,800 | $0 | $0 |
| 2018 | $1,918 | $42,250 | $0 | $0 |
| 2017 | $1,877 | $43,000 | $0 | $0 |
| 2016 | $1,867 | $40,800 | $0 | $40,800 |
| 2015 | $1,402 | $37,800 | $0 | $37,800 |
| 2014 | $1,402 | $30,550 | $0 | $30,550 |
Source: Public Records
Map
Nearby Homes