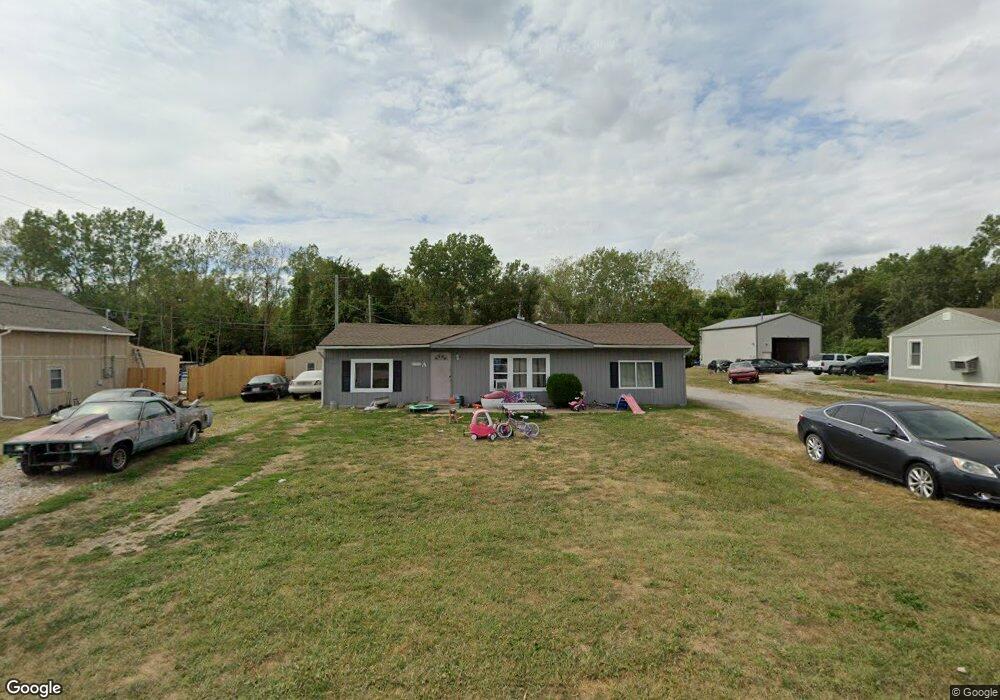
1612 SE Summit St Lees Summit, MO 64081
Estimated Value: $189,680 - $243,000
2
Beds
1
Bath
1,104
Sq Ft
$199/Sq Ft
Est. Value
About This Home
This home is located at 1612 SE Summit St, Lees Summit, MO 64081 and is currently estimated at $219,920, approximately $199 per square foot. 1612 SE Summit St is a home located in Jackson County with nearby schools including Pleasant Lea Middle School, Lee's Summit Senior High School, and Summit Christian Academy.
Ownership History
Date
Name
Owned For
Owner Type
Purchase Details
Closed on
Aug 31, 2006
Sold by
Richter Darren and Richter Elizabeth
Bought by
Forster Stephen N and Forster Suzanne C
Current Estimated Value
Purchase Details
Closed on
Nov 3, 2003
Sold by
Forster Stephen N and Forster Suzanne C
Bought by
Richter Darren and Richter Elizabeth
Home Financials for this Owner
Home Financials are based on the most recent Mortgage that was taken out on this home.
Original Mortgage
$55,512
Interest Rate
5.96%
Mortgage Type
Seller Take Back
Purchase Details
Closed on
Oct 31, 2001
Sold by
Rohrs J Douglas
Bought by
Forster Stephen N and Forster Suzanne C
Home Financials for this Owner
Home Financials are based on the most recent Mortgage that was taken out on this home.
Original Mortgage
$55,512
Interest Rate
6.77%
Mortgage Type
Purchase Money Mortgage
Create a Home Valuation Report for This Property
The Home Valuation Report is an in-depth analysis detailing your home's value as well as a comparison with similar homes in the area
Home Values in the Area
Average Home Value in this Area
Purchase History
| Date | Buyer | Sale Price | Title Company |
|---|---|---|---|
| Forster Stephen N | $80,855 | None Available | |
| Richter Darren | -- | Security Land Title Company | |
| Forster Stephen N | -- | Columbian National Title |
Source: Public Records
Mortgage History
| Date | Status | Borrower | Loan Amount |
|---|---|---|---|
| Previous Owner | Richter Darren | $55,512 | |
| Previous Owner | Forster Stephen N | $55,512 |
Source: Public Records
Tax History
| Year | Tax Paid | Tax Assessment Tax Assessment Total Assessment is a certain percentage of the fair market value that is determined by local assessors to be the total taxable value of land and additions on the property. | Land | Improvement |
|---|---|---|---|---|
| 2025 | $1,852 | $24,123 | $13,652 | $10,471 |
| 2024 | $1,839 | $25,650 | $12,209 | $13,441 |
| 2023 | $1,839 | $25,650 | $12,209 | $13,441 |
| 2022 | $1,472 | $18,240 | $3,034 | $15,206 |
| 2021 | $1,503 | $18,240 | $3,034 | $15,206 |
| 2020 | $1,438 | $17,287 | $3,034 | $14,253 |
| 2019 | $1,399 | $17,287 | $3,034 | $14,253 |
| 2018 | $1,312 | $15,045 | $2,640 | $12,405 |
| 2017 | $1,312 | $15,045 | $2,640 | $12,405 |
| 2016 | $1,292 | $14,668 | $2,831 | $11,837 |
| 2014 | $1,274 | $14,170 | $2,824 | $11,346 |
Source: Public Records
Map
Nearby Homes
- 1402 SW Jefferson St
- 1302 SE Broadway Ct
- 1335 SE Broadway Cir
- 1313 SE Broadway Cir Unit B
- 1324 SE Norwood Dr
- 1412 SE Lexington Ave
- 1322 SE Lexington Ave
- 1325 SE Lexington Ave Unit 134C
- 1440 SW Mission Rd
- 722 SE 13th St
- 704 SE 11th St
- 105 SE 9th St
- 1206 SW Mission Place
- 1111 SW Mission Place
- 719 SE London Way
- 3705 SW Walsh Dr
- 618 SE Miller St
- 1012 SE Wingate Ct
- 727 SE 10th St
- 2501 SW M 291 Hwy
- 1610 SE Summit St
- 1614 SE Summit St
- 201 SE 16th Terrace
- 1606 SE Summit St
- 203 SE 16th Terrace
- 200 SE 16th Terrace
- 1604 SE Summit St
- 202 SE 16th Terrace
- 204 SE 16th Terrace
- 107 SE 16th St
- 201 SE 16th St
- 206 SE 16th Terrace
- 203 SE 16th St
- 209 SE 16th Terrace
- 205 SE 16th St
- 208 SE 16th Terrace
- 1619 SE Decker
- 1625 SE Decker St
- 211 SE 16th Terrace
- 207 SE 16th St
Your Personal Tour Guide
Ask me questions while you tour the home.