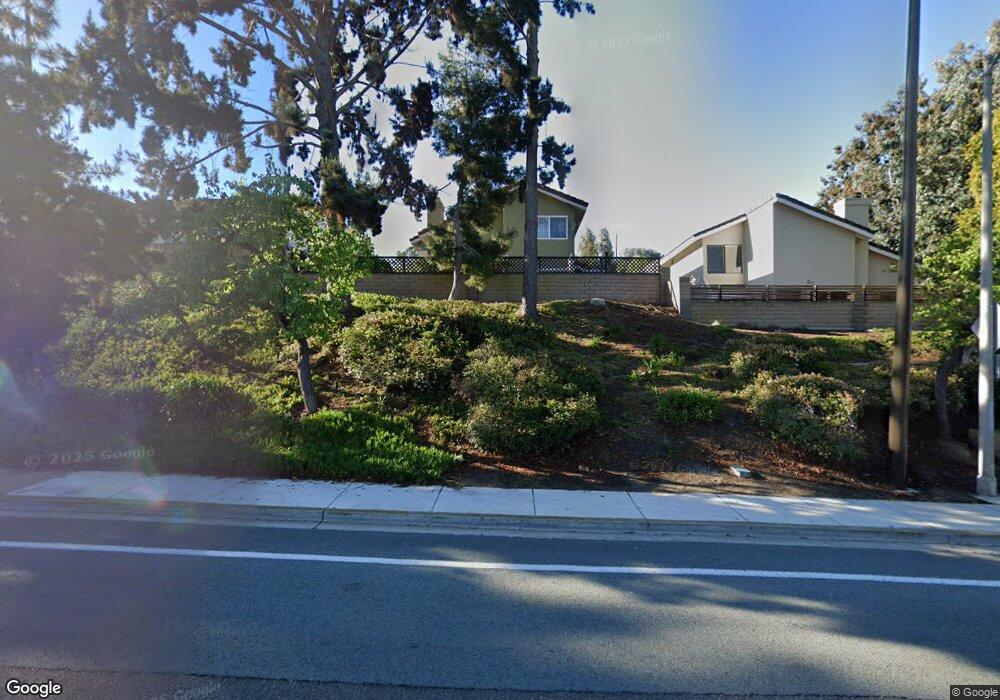
1612 Tennis Match Way Encinitas, CA 92024
Central Encinitas NeighborhoodEstimated Value: $1,311,000 - $1,485,000
3
Beds
3
Baths
1,567
Sq Ft
$911/Sq Ft
Est. Value
About This Home
This home is located at 1612 Tennis Match Way, Encinitas, CA 92024 and is currently estimated at $1,426,860, approximately $910 per square foot. 1612 Tennis Match Way is a home located in San Diego County with nearby schools including Flora Vista Elementary, Diegueno Middle School, and La Costa Canyon High School.
Ownership History
Date
Name
Owned For
Owner Type
Purchase Details
Closed on
Mar 9, 2012
Sold by
Anderson Anthony B and Anderson Janie L
Bought by
Anderson Anthony Bryan and Anderson Janie Lynn
Current Estimated Value
Purchase Details
Closed on
Nov 14, 2001
Sold by
Va
Bought by
Anderson Anthony B and Anderson Janie L
Home Financials for this Owner
Home Financials are based on the most recent Mortgage that was taken out on this home.
Original Mortgage
$173,500
Interest Rate
6.57%
Purchase Details
Closed on
May 22, 1995
Sold by
Kruse James S and Kruse Monica
Bought by
Va
Purchase Details
Closed on
Oct 16, 1991
Purchase Details
Closed on
Jun 15, 1988
Purchase Details
Closed on
Jun 13, 1986
Create a Home Valuation Report for This Property
The Home Valuation Report is an in-depth analysis detailing your home's value as well as a comparison with similar homes in the area
Home Values in the Area
Average Home Value in this Area
Purchase History
| Date | Buyer | Sale Price | Title Company |
|---|---|---|---|
| Anderson Anthony Bryan | -- | None Available | |
| Anderson Anthony B | -- | First American Title | |
| Va | $188,000 | First American Title Co | |
| -- | $219,800 | -- | |
| -- | $164,000 | -- | |
| -- | $145,000 | -- |
Source: Public Records
Mortgage History
| Date | Status | Borrower | Loan Amount |
|---|---|---|---|
| Previous Owner | Anderson Anthony B | $173,500 |
Source: Public Records
Tax History Compared to Growth
Tax History
| Year | Tax Paid | Tax Assessment Tax Assessment Total Assessment is a certain percentage of the fair market value that is determined by local assessors to be the total taxable value of land and additions on the property. | Land | Improvement |
|---|---|---|---|---|
| 2025 | $3,831 | $315,754 | $167,955 | $147,799 |
| 2024 | $3,831 | $309,563 | $164,662 | $144,901 |
| 2023 | $3,694 | $303,494 | $161,434 | $142,060 |
| 2022 | $3,586 | $297,544 | $158,269 | $139,275 |
| 2021 | $3,507 | $291,711 | $155,166 | $136,545 |
| 2020 | $3,434 | $288,720 | $153,575 | $135,145 |
| 2019 | $3,369 | $283,060 | $150,564 | $132,496 |
| 2018 | $3,317 | $277,511 | $147,612 | $129,899 |
| 2017 | $3,262 | $272,070 | $144,718 | $127,352 |
| 2016 | $3,168 | $266,736 | $141,881 | $124,855 |
| 2015 | $3,096 | $262,730 | $139,750 | $122,980 |
| 2014 | $3,012 | $257,584 | $137,013 | $120,571 |
Source: Public Records
Map
Nearby Homes
- 1617 Blossom Field Way
- 1709 Edgefield Ln
- 1519 Valleda Ln
- 451 Jolina Way
- 1641 Tucker Ln
- 3736 38 Via Rancho Michelle
- 658 660 Santa fe Dr
- 772 Conestoga Ct
- 1655 Splitrail Dr
- 1785 Caliban Dr
- 1848 Wandering Rd
- 1583 Avenida de Los Lirios Unit A
- 1838 Stonebrook Ln
- 1824 Eastwood Ln
- 350 N El Camino Real Unit 50
- 213 Via Palacio
- 1633 Willowspring Dr N
- 608 Crest Dr
- 155 Countrywood Ln
- 2005 Countrywood Ct
- 1618 Tennis Match Way
- 1606 Tennis Match Way
- 1624 Tennis Match Way
- 1628 Tennis Match Way
- 1607 Tennis Match Way
- 1617 Tennis Match Way
- 1605 Tennis Match Way
- 1590 Tennis Match Way
- 1632 Tennis Match Way
- 1623 Tennis Match Way
- 1607 Linda Sue Ln
- 1601 Linda Sue Ln
- 1613 Linda Sue Ln
- 1627 Tennis Match Way
- 1636 Tennis Match Way
- 1580 Tennis Match Way
- 1619 Linda Sue Ln
- 1652 Shadow Mountain Dr
- 1631 Tennis Match Way
- 1642 Tennis Match Way