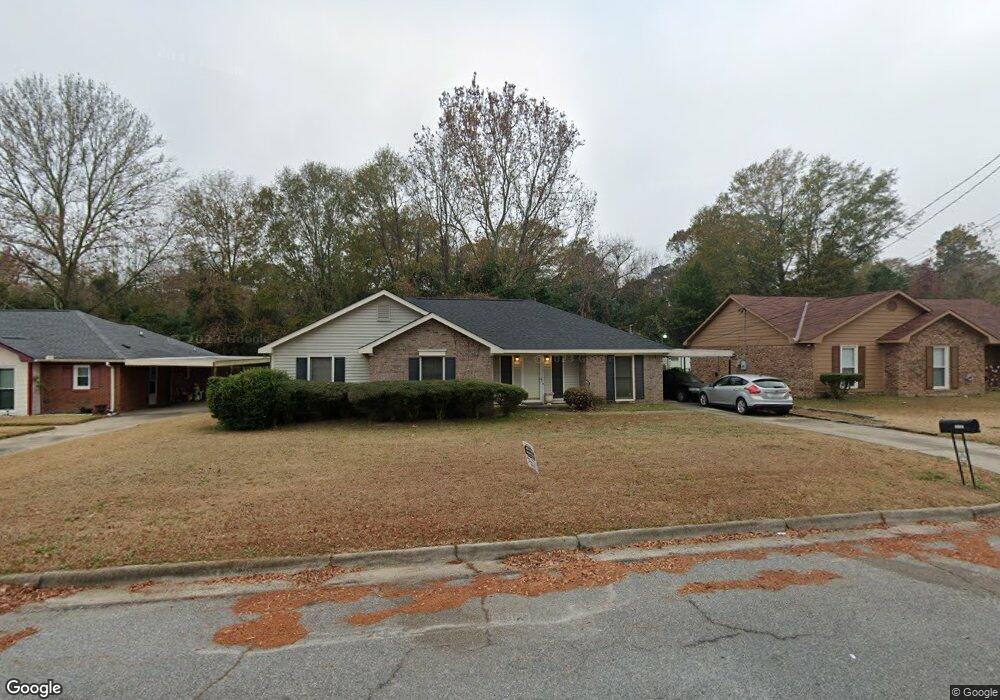
1613 Laney Dr Columbus, GA 31907
Eastern Columbus NeighborhoodEstimated Value: $159,000 - $195,000
3
Beds
3
Baths
1,672
Sq Ft
$109/Sq Ft
Est. Value
About This Home
This home is located at 1613 Laney Dr, Columbus, GA 31907 and is currently estimated at $182,611, approximately $109 per square foot. 1613 Laney Dr is a home located in Muscogee County with nearby schools including Wesley Heights Elementary School, East Columbus Magnet Academy, and Kendrick High School.
Ownership History
Date
Name
Owned For
Owner Type
Purchase Details
Closed on
Aug 31, 2016
Sold by
Webb John H and Webb Amy E
Bought by
Louis Jude and Royal Zakiyya Marie
Current Estimated Value
Home Financials for this Owner
Home Financials are based on the most recent Mortgage that was taken out on this home.
Original Mortgage
$73,052
Outstanding Balance
$58,011
Interest Rate
3.25%
Mortgage Type
FHA
Estimated Equity
$124,600
Purchase Details
Closed on
Jul 11, 2008
Sold by
The Parkland Corp
Bought by
Webb John H and Webb Amy E
Home Financials for this Owner
Home Financials are based on the most recent Mortgage that was taken out on this home.
Original Mortgage
$142,907
Interest Rate
6.27%
Purchase Details
Closed on
Feb 29, 2008
Sold by
Lindsey Christopher B
Bought by
The Parkland Corp
Create a Home Valuation Report for This Property
The Home Valuation Report is an in-depth analysis detailing your home's value as well as a comparison with similar homes in the area
Home Values in the Area
Average Home Value in this Area
Purchase History
| Date | Buyer | Sale Price | Title Company |
|---|---|---|---|
| Louis Jude | $74,400 | -- | |
| Webb John H | $139,900 | None Available | |
| The Parkland Corp | $139,900 | None Available |
Source: Public Records
Mortgage History
| Date | Status | Borrower | Loan Amount |
|---|---|---|---|
| Open | Louis Jude | $73,052 | |
| Previous Owner | Webb John H | $142,907 |
Source: Public Records
Tax History Compared to Growth
Tax History
| Year | Tax Paid | Tax Assessment Tax Assessment Total Assessment is a certain percentage of the fair market value that is determined by local assessors to be the total taxable value of land and additions on the property. | Land | Improvement |
|---|---|---|---|---|
| 2025 | $649 | $63,172 | $8,756 | $54,416 |
| 2024 | $648 | $63,172 | $8,756 | $54,416 |
| 2023 | $25 | $63,172 | $8,756 | $54,416 |
| 2022 | $675 | $51,784 | $8,756 | $43,028 |
| 2021 | $668 | $46,948 | $8,756 | $38,192 |
| 2020 | $669 | $46,948 | $8,756 | $38,192 |
| 2019 | $673 | $46,948 | $8,756 | $38,192 |
| 2018 | $673 | $46,948 | $8,756 | $38,192 |
| 2017 | $676 | $29,760 | $5,480 | $24,280 |
| 2016 | $2,307 | $55,935 | $6,400 | $49,535 |
| 2015 | $2,310 | $55,935 | $6,400 | $49,535 |
| 2014 | $2,313 | $55,935 | $6,400 | $49,535 |
| 2013 | -- | $55,935 | $6,400 | $49,535 |
Source: Public Records
Map
Nearby Homes
- 6213 Fitzgerald Dr
- 6032 Cordova Rd
- 1607 Mazor Dr
- 6047 Capri Cir
- 1754 Mazor Dr
- 1925 Woodhollow Dr
- 1826 Woodhollow Dr
- 6033 Luna Dr
- 6061 Luna Dr
- 1322 Melford Dr
- 6119 Mill Branch Rd
- 1068 Valencia Dr
- 5834 Blueridge Dr
- 6916 Bradshaw Dr
- 6188 Valencia Dr
- 5500 Amber Dr
- 6620 Cove Cir
- 5920 Gleneden Dr
- 5929 Gleneden Dr
- 2525 Corineth Dr
- 1619 Laney Dr
- 1607 Laney Dr
- 1625 Laney Dr
- 1601 Laney Dr
- 6205 Fitzgerald Dr
- 1616 Laney Dr
- 6204 Albright Dr
- 1602 Celeste Dr
- 1631 Laney Dr
- 6200 Fitzgerald Dr
- 6206 Fitzgerald Dr
- 6210 Albright Dr
- 1701 Laney Dr
- 6212 Fitzgerald Dr
- 6219 Fitzgerald Dr
- 6203 Albright Dr
- 6216 Albright Dr
- 6213 Cordova Rd
- 6207 Cordova Rd
- 6219 Cordova Rd