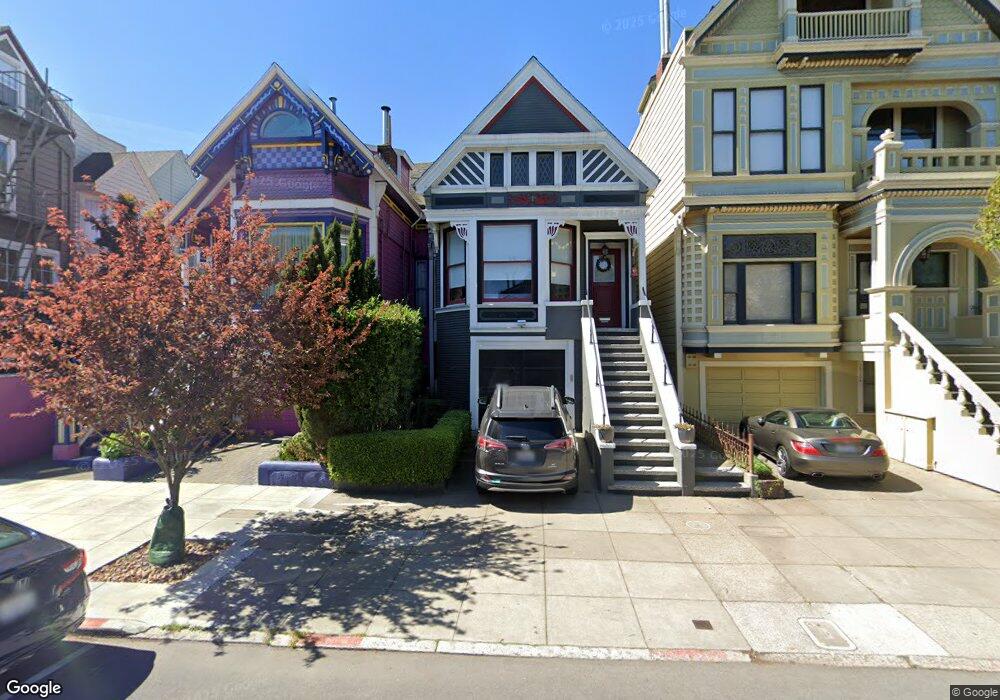
1613 Lyon St San Francisco, CA 94115
Lower Pacific Heights NeighborhoodEstimated Value: $1,753,000 - $2,639,000
3
Beds
3
Baths
1,980
Sq Ft
$1,163/Sq Ft
Est. Value
About This Home
This home is located at 1613 Lyon St, San Francisco, CA 94115 and is currently estimated at $2,303,296, approximately $1,163 per square foot. 1613 Lyon St is a home located in San Francisco County with nearby schools including Cobb (William L.) Elementary School, Roosevelt Middle School, and KIPP San Francisco Bay Academy.
Ownership History
Date
Name
Owned For
Owner Type
Purchase Details
Closed on
May 21, 2011
Sold by
Henning Luce Diane
Bought by
Uecker Susan L and Shulman John B
Current Estimated Value
Home Financials for this Owner
Home Financials are based on the most recent Mortgage that was taken out on this home.
Original Mortgage
$350,000
Outstanding Balance
$21,517
Interest Rate
4.84%
Mortgage Type
New Conventional
Estimated Equity
$2,281,779
Purchase Details
Closed on
Jul 3, 2008
Sold by
Henning Luce Diane and Luce Dianne Henning
Bought by
Henning Luce Diane
Home Financials for this Owner
Home Financials are based on the most recent Mortgage that was taken out on this home.
Original Mortgage
$285,000
Interest Rate
5.25%
Mortgage Type
New Conventional
Purchase Details
Closed on
Jul 16, 1999
Sold by
Skeie George S
Bought by
Luce Donald and Luce Diane Henning
Home Financials for this Owner
Home Financials are based on the most recent Mortgage that was taken out on this home.
Original Mortgage
$554,250
Interest Rate
7.62%
Create a Home Valuation Report for This Property
The Home Valuation Report is an in-depth analysis detailing your home's value as well as a comparison with similar homes in the area
Home Values in the Area
Average Home Value in this Area
Purchase History
| Date | Buyer | Sale Price | Title Company |
|---|---|---|---|
| Uecker Susan L | $1,275,000 | Fidelity National Title Co | |
| Henning Luce Diane | -- | Stewart Title Of California | |
| Luce Donald | $739,000 | Old Republic Title Company |
Source: Public Records
Mortgage History
| Date | Status | Borrower | Loan Amount |
|---|---|---|---|
| Open | Uecker Susan L | $350,000 | |
| Previous Owner | Henning Luce Diane | $285,000 | |
| Previous Owner | Luce Donald | $554,250 |
Source: Public Records
Tax History Compared to Growth
Tax History
| Year | Tax Paid | Tax Assessment Tax Assessment Total Assessment is a certain percentage of the fair market value that is determined by local assessors to be the total taxable value of land and additions on the property. | Land | Improvement |
|---|---|---|---|---|
| 2025 | $19,421 | $1,688,551 | $1,143,443 | $545,108 |
| 2024 | $19,421 | $1,655,444 | $1,121,023 | $534,421 |
| 2023 | $19,142 | $1,622,986 | $1,099,043 | $523,943 |
| 2022 | $18,800 | $1,591,165 | $1,077,494 | $513,671 |
| 2021 | $18,475 | $1,559,967 | $1,056,367 | $503,600 |
| 2020 | $19,160 | $1,543,973 | $1,045,536 | $498,437 |
| 2019 | $18,501 | $1,513,700 | $1,025,036 | $488,664 |
| 2018 | $17,313 | $1,435,625 | $1,004,938 | $430,687 |
| 2017 | $16,810 | $1,407,477 | $985,234 | $422,243 |
| 2016 | $16,541 | $1,379,880 | $965,916 | $413,964 |
| 2015 | $16,336 | $1,359,154 | $951,408 | $407,746 |
| 2014 | $15,645 | $1,332,531 | $932,772 | $399,759 |
Source: Public Records
Map
Nearby Homes
- 3014 Pine St
- 3014 Pine St Unit A
- 2978 Pine St
- 1450 Lyon St
- 3100 California St
- 2825 Pine St
- 1819 Lyon St Unit 3
- 1819 Lyon St Unit 1
- 333 Presidio Ave Unit 5
- 1910 Baker St
- 2654-2656 Bush St
- 2655 Bush St Unit 109
- 2655 Bush St Unit 603
- 2655 Bush St Unit 431
- 22 Wood St
- 440 Laurel St
- 2025 Broderick St Unit 6
- 2033 Broderick St
- 436a Laurel St
- 21 Wood St
- 1611 Lyon St
- 1615 Lyon St
- 1617 Lyon St
- 1619 Lyon St
- 2904 Bush St
- 2902 Bush St
- 2906 Bush St
- 2908 Bush St Unit 2912
- 2912 Bush St
- 2900 Bush St
- 1625 Lyon St Unit 1629
- 1631 Lyon St Unit 1635
- 2946 Bush St
- 3025 Pine St
- 3019 Pine St Unit 3023
- 2948 Bush St
- 3031 Pine St Unit 3035
- 1600 Lyon St
- 2950 Bush St
- 3037 Pine St Unit 3041