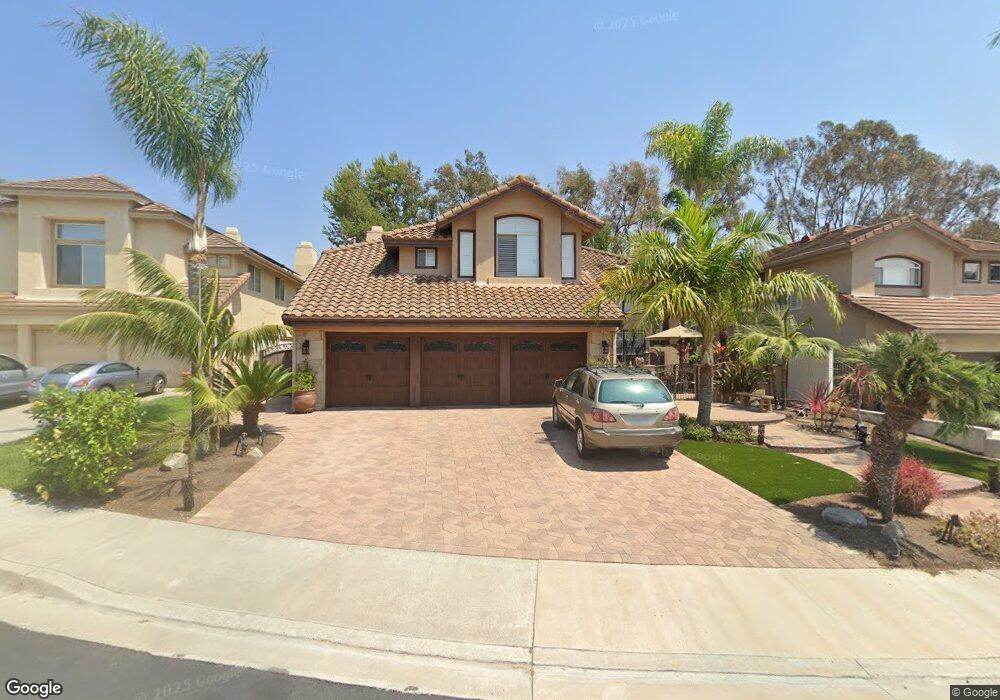
1613 Via Calendula San Clemente, CA 92673
Forster Ranch NeighborhoodEstimated Value: $1,748,000 - $1,852,000
3
Beds
3
Baths
2,981
Sq Ft
$597/Sq Ft
Est. Value
About This Home
This home is located at 1613 Via Calendula, San Clemente, CA 92673 and is currently estimated at $1,780,923, approximately $597 per square foot. 1613 Via Calendula is a home located in Orange County with nearby schools including Truman Benedict Elementary School, Bernice Ayer Middle School, and San Clemente High School.
Ownership History
Date
Name
Owned For
Owner Type
Purchase Details
Closed on
Oct 25, 2002
Sold by
Morell Linda A
Bought by
Morell Linda Ann
Current Estimated Value
Home Financials for this Owner
Home Financials are based on the most recent Mortgage that was taken out on this home.
Original Mortgage
$225,000
Interest Rate
5.88%
Purchase Details
Closed on
Nov 28, 2000
Sold by
Morell Linda Ann
Bought by
Morell Linda A and Linda A Morell Revocable Living Trust
Home Financials for this Owner
Home Financials are based on the most recent Mortgage that was taken out on this home.
Original Mortgage
$240,000
Interest Rate
7.86%
Purchase Details
Closed on
Oct 18, 2000
Sold by
Binns Robert K and Binns Jodi L
Bought by
Morell Linda Ann
Home Financials for this Owner
Home Financials are based on the most recent Mortgage that was taken out on this home.
Original Mortgage
$240,000
Interest Rate
7.86%
Create a Home Valuation Report for This Property
The Home Valuation Report is an in-depth analysis detailing your home's value as well as a comparison with similar homes in the area
Home Values in the Area
Average Home Value in this Area
Purchase History
| Date | Buyer | Sale Price | Title Company |
|---|---|---|---|
| Morell Linda Ann | -- | Gateway Title Company | |
| Morell Linda A | -- | -- | |
| Morell Linda Ann | $455,000 | Chicago Title Co |
Source: Public Records
Mortgage History
| Date | Status | Borrower | Loan Amount |
|---|---|---|---|
| Closed | Morell Linda Ann | $225,000 | |
| Closed | Morell Linda Ann | $240,000 |
Source: Public Records
Tax History Compared to Growth
Tax History
| Year | Tax Paid | Tax Assessment Tax Assessment Total Assessment is a certain percentage of the fair market value that is determined by local assessors to be the total taxable value of land and additions on the property. | Land | Improvement |
|---|---|---|---|---|
| 2025 | $6,840 | $694,691 | $331,956 | $362,735 |
| 2024 | $6,840 | $681,070 | $325,447 | $355,623 |
| 2023 | $6,694 | $667,716 | $319,066 | $348,650 |
| 2022 | $6,565 | $654,624 | $312,810 | $341,814 |
| 2021 | $6,437 | $641,789 | $306,677 | $335,112 |
| 2020 | $6,373 | $635,209 | $303,533 | $331,676 |
| 2019 | $6,246 | $622,754 | $297,581 | $325,173 |
| 2018 | $6,125 | $610,544 | $291,746 | $318,798 |
| 2017 | $6,004 | $598,573 | $286,025 | $312,548 |
| 2016 | $5,888 | $586,837 | $280,417 | $306,420 |
| 2015 | $5,798 | $578,023 | $276,205 | $301,818 |
| 2014 | $5,686 | $566,701 | $270,795 | $295,906 |
Source: Public Records
Map
Nearby Homes
- 1200 Cerca
- 5417 Camino Mojado
- 3003 Geraldo
- 2914 Obrajero
- 110 Del Cabo Unit C34
- 2880 Calle Guadalajara
- 101 Mira Adelante Unit 101
- 53 Mira Las Olas
- 201 Mira Adelante
- 1405 Manera Ventosa
- 2428 Camino Oleada
- 31262 Avenida Terramar
- 26 Mira Las Olas
- 752 Calle Vallarta
- 31232 Calle Bolero
- 10 Calle Verdadero
- 15 Calle Gaulteria
- 602 Calle Ganadero
- 14 Tesoro
- 28101 Pacifica Del Mar
- 1611 Via Calendula
- 1615 Via Calendula
- 1609 Via Calendula
- 1617 Via Calendula
- 1910 Via Pimpollo
- 1908 Via Pimpollo
- 1906 Via Pimpollo
- 1610 Via Calendula
- 1607 Via Calendula
- 1912 Via Pimpollo
- 1612 Via Calendula
- 1608 Via Calendula
- 1619 Via Calendula
- 1904 Via Pimpollo
- 1616 Via Calendula
- 1614 Via Calendula
- 1606 Via Calendula
- 1914 Via Pimpollo
- 1605 Via Calendula
- 1902 Via Pimpollo