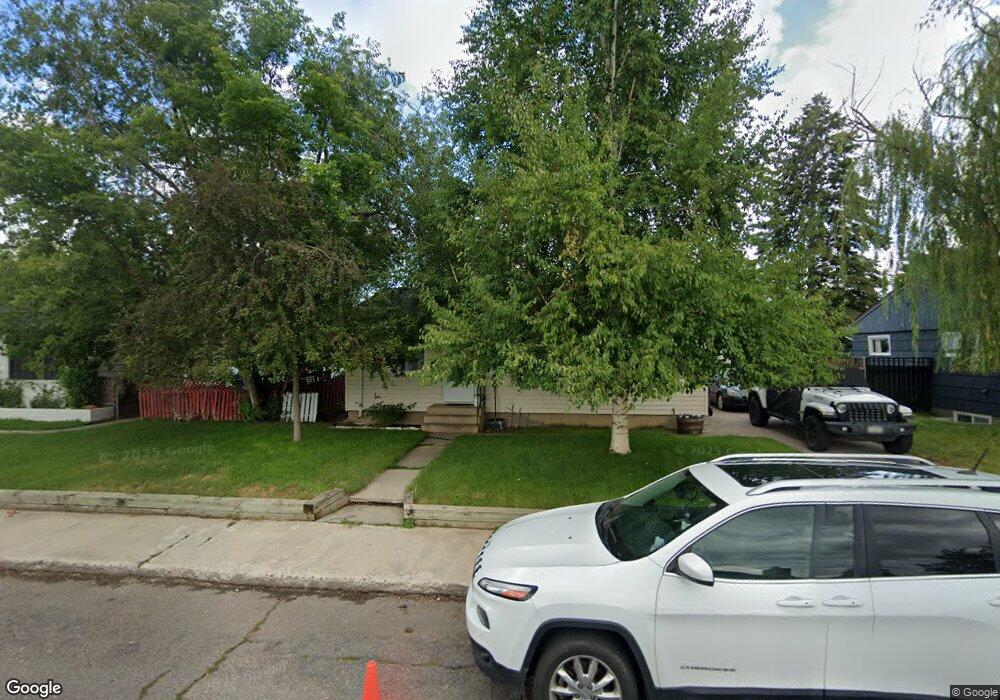
1618 Bel Air Place Missoula, MT 59801
Southgate Triangle NeighborhoodEstimated Value: $479,000 - $548,000
3
Beds
2
Baths
816
Sq Ft
$624/Sq Ft
Est. Value
About This Home
This home is located at 1618 Bel Air Place, Missoula, MT 59801 and is currently estimated at $509,536, approximately $624 per square foot. 1618 Bel Air Place is a home located in Missoula County with nearby schools including Russell School, Meadow Hill Middle School, and Sentinel High School.
Ownership History
Date
Name
Owned For
Owner Type
Purchase Details
Closed on
Jul 29, 2009
Sold by
Morse Deborah E and Randall Deborah A
Bought by
Randall Deborah A and Randall Loren W
Current Estimated Value
Home Financials for this Owner
Home Financials are based on the most recent Mortgage that was taken out on this home.
Original Mortgage
$100,000
Interest Rate
5.31%
Mortgage Type
New Conventional
Purchase Details
Closed on
Nov 29, 2001
Sold by
Woirhaye Lynda D
Bought by
Morse Deborah E
Home Financials for this Owner
Home Financials are based on the most recent Mortgage that was taken out on this home.
Original Mortgage
$116,700
Interest Rate
6.63%
Mortgage Type
FHA
Purchase Details
Closed on
Jan 26, 2001
Sold by
Nooney William J
Bought by
Woirhaye Lynda D
Home Financials for this Owner
Home Financials are based on the most recent Mortgage that was taken out on this home.
Original Mortgage
$106,000
Interest Rate
7.13%
Purchase Details
Closed on
Oct 20, 2000
Sold by
Gregory Donnelle R and Gregory Donelle R
Bought by
Nooney William J
Create a Home Valuation Report for This Property
The Home Valuation Report is an in-depth analysis detailing your home's value as well as a comparison with similar homes in the area
Home Values in the Area
Average Home Value in this Area
Purchase History
| Date | Buyer | Sale Price | Title Company |
|---|---|---|---|
| Randall Deborah A | -- | First American Title Company | |
| Morse Deborah E | -- | -- | |
| Woirhaye Lynda D | -- | -- | |
| Nooney William J | -- | -- |
Source: Public Records
Mortgage History
| Date | Status | Borrower | Loan Amount |
|---|---|---|---|
| Closed | Randall Deborah A | $100,000 | |
| Closed | Morse Deborah E | $116,700 | |
| Previous Owner | Woirhaye Lynda D | $106,000 |
Source: Public Records
Tax History Compared to Growth
Tax History
| Year | Tax Paid | Tax Assessment Tax Assessment Total Assessment is a certain percentage of the fair market value that is determined by local assessors to be the total taxable value of land and additions on the property. | Land | Improvement |
|---|---|---|---|---|
| 2025 | $4,259 | $433,000 | $146,520 | $286,480 |
| 2024 | $4,043 | $332,200 | $115,700 | $216,500 |
| 2023 | $3,942 | $332,200 | $115,700 | $216,500 |
| 2022 | $3,576 | $261,110 | $0 | $0 |
| 2021 | $3,172 | $261,110 | $0 | $0 |
| 2020 | $2,722 | $204,400 | $0 | $0 |
| 2019 | $2,714 | $204,400 | $0 | $0 |
| 2018 | $2,658 | $194,700 | $0 | $0 |
| 2017 | $2,334 | $194,700 | $0 | $0 |
| 2016 | $2,452 | $189,900 | $0 | $0 |
| 2015 | $2,270 | $189,900 | $0 | $0 |
| 2014 | $2,274 | $107,166 | $0 | $0 |
Source: Public Records
Map
Nearby Homes
- 3 Rosebud Ln
- 1665 W Sussex Ave
- 1811 Charlott Ave
- 3530 Washburn St
- 3711 Bellecrest Dr
- 235 S 4th St E Unit 203
- 265 S 4th St E Unit 208
- 265 S 4th St E Unit 111
- 265 S 4th St E Unit 405
- 1755 North Ave W
- 2960 Eaton St Unit C
- 3609 Paxson St
- 3032 Eaton St
- 3607 Paxson St
- 3914 Bellecrest Dr
- 1765 Cyprus Ct
- 2112 & 2112 1/2 W Central Ave
- 3800 S Russell St Unit 1A
- 3800 S Russell St
- 720 South Ave W
- 1618 Bel Place
- 1618 Bel Place Unit Bel-air
- 1612 Bel Air Place
- 1620 Bel Air Place
- 1612 Bel-Air Place
- 1610 Bel Air Place
- 1626 Bel Air Place
- 1617 Bel Vue Dr
- 1613 Bel Vue Dr
- 1621 Bel Vue Dr
- 1617 Bel Air Place
- 1630 Bel Air Place
- 1630 Bel Place
- 1630 Bel Place Unit Bel-air
- 1609 Bel Vue Dr
- 1621 Bel Air Place
- 1613 Bel Air Place
- 1625 Bel Vue Dr
- 2707 Washburn St
- 1602 Bel Air Place