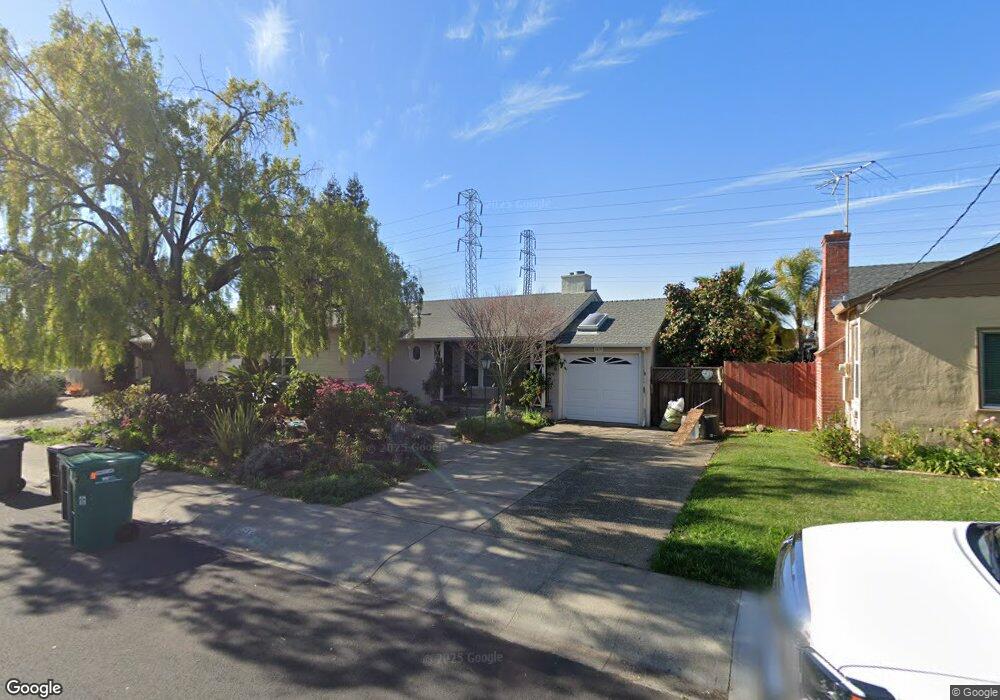
1619 136th Ave San Leandro, CA 94578
Assumption Parish NeighborhoodEstimated Value: $731,000 - $833,000
3
Beds
1
Bath
1,134
Sq Ft
$692/Sq Ft
Est. Value
About This Home
This home is located at 1619 136th Ave, San Leandro, CA 94578 and is currently estimated at $785,229, approximately $692 per square foot. 1619 136th Ave is a home located in Alameda County with nearby schools including McKinley Elementary School, Bancroft Middle School, and San Leandro High School.
Ownership History
Date
Name
Owned For
Owner Type
Purchase Details
Closed on
Feb 24, 2005
Sold by
Cadigan Emmett Liam
Bought by
Cadigan Emmett and Cadigan Julie
Current Estimated Value
Home Financials for this Owner
Home Financials are based on the most recent Mortgage that was taken out on this home.
Original Mortgage
$359,650
Outstanding Balance
$182,816
Interest Rate
5.65%
Mortgage Type
New Conventional
Estimated Equity
$602,413
Purchase Details
Closed on
Apr 21, 2003
Sold by
Heckart Dennis Lee
Bought by
Cadigan Emmett Liam
Home Financials for this Owner
Home Financials are based on the most recent Mortgage that was taken out on this home.
Original Mortgage
$292,000
Interest Rate
5.71%
Purchase Details
Closed on
May 12, 1995
Sold by
Oftedahl Archie
Bought by
Heckart Dennis Lee
Create a Home Valuation Report for This Property
The Home Valuation Report is an in-depth analysis detailing your home's value as well as a comparison with similar homes in the area
Home Values in the Area
Average Home Value in this Area
Purchase History
| Date | Buyer | Sale Price | Title Company |
|---|---|---|---|
| Cadigan Emmett | -- | Chicago Title Co | |
| Cadigan Emmett Liam | $365,500 | -- | |
| Heckart Dennis Lee | -- | -- |
Source: Public Records
Mortgage History
| Date | Status | Borrower | Loan Amount |
|---|---|---|---|
| Open | Cadigan Emmett | $359,650 | |
| Closed | Cadigan Emmett Liam | $292,000 | |
| Closed | Cadigan Emmett Liam | $36,500 |
Source: Public Records
Tax History Compared to Growth
Tax History
| Year | Tax Paid | Tax Assessment Tax Assessment Total Assessment is a certain percentage of the fair market value that is determined by local assessors to be the total taxable value of land and additions on the property. | Land | Improvement |
|---|---|---|---|---|
| 2025 | $6,965 | $522,316 | $158,867 | $370,449 |
| 2024 | $6,965 | $511,940 | $155,753 | $363,187 |
| 2023 | $6,985 | $508,768 | $152,700 | $356,068 |
| 2022 | $6,771 | $491,793 | $149,706 | $349,087 |
| 2021 | $6,576 | $482,017 | $146,772 | $342,245 |
| 2020 | $6,414 | $484,006 | $145,268 | $338,738 |
| 2019 | $6,210 | $474,517 | $142,420 | $332,097 |
| 2018 | $6,030 | $465,215 | $139,628 | $325,587 |
| 2017 | $5,913 | $456,096 | $136,891 | $319,205 |
| 2016 | $5,591 | $447,156 | $134,208 | $312,948 |
| 2015 | $5,485 | $440,441 | $132,192 | $308,249 |
| 2014 | $4,489 | $350,000 | $105,000 | $245,000 |
Source: Public Records
Map
Nearby Homes
- 2147 Trombas Ave
- 851 Kenyon Ave
- 1508 141st Ave
- 14101 E 14th St Unit 306
- 1253 139th Ave
- 2378 Cheshire Place
- 775 Elsie Ave
- 1293 Vistagrand Dr
- 2460 Dundee Ct
- 1162 136th Ave
- 2399 E 14th St Unit 143
- 2399 E 14th St Unit 66
- 2399 E 14th St Unit 159
- 2399 E 14th St Unit 24
- 2399 E 14th St Unit 112
- 678 Elsie Ave
- 1247 Benedict Ct
- 1876 Benedict Dr
- 2470 Washington Ave Unit SPC 11
- 1639 Washington Ave