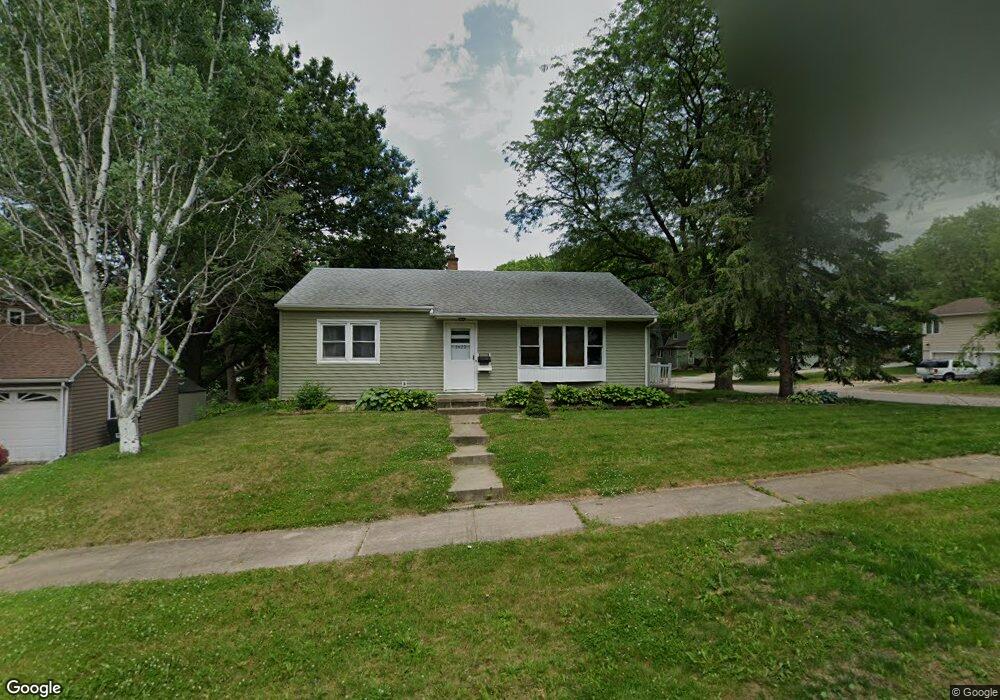
1622 Iowa St Cedar Falls, IA 50613
Estimated Value: $182,000 - $204,000
2
Beds
3
Baths
988
Sq Ft
$194/Sq Ft
Est. Value
About This Home
This home is located at 1622 Iowa St, Cedar Falls, IA 50613 and is currently estimated at $191,407, approximately $193 per square foot. 1622 Iowa St is a home located in Black Hawk County with nearby schools including Lincoln Elementary School, Holmes Junior High School, and Cedar Falls High School.
Ownership History
Date
Name
Owned For
Owner Type
Purchase Details
Closed on
Dec 9, 2016
Sold by
Showalter Charles W and Showalter Kylie L
Bought by
Trunck Dillan D
Current Estimated Value
Home Financials for this Owner
Home Financials are based on the most recent Mortgage that was taken out on this home.
Original Mortgage
$110,500
Outstanding Balance
$52,651
Interest Rate
3.57%
Mortgage Type
New Conventional
Estimated Equity
$138,756
Create a Home Valuation Report for This Property
The Home Valuation Report is an in-depth analysis detailing your home's value as well as a comparison with similar homes in the area
Home Values in the Area
Average Home Value in this Area
Purchase History
| Date | Buyer | Sale Price | Title Company |
|---|---|---|---|
| Trunck Dillan D | $130,000 | None Available |
Source: Public Records
Mortgage History
| Date | Status | Borrower | Loan Amount |
|---|---|---|---|
| Open | Trunck Dillan D | $110,500 |
Source: Public Records
Tax History Compared to Growth
Tax History
| Year | Tax Paid | Tax Assessment Tax Assessment Total Assessment is a certain percentage of the fair market value that is determined by local assessors to be the total taxable value of land and additions on the property. | Land | Improvement |
|---|---|---|---|---|
| 2025 | $3,084 | $206,110 | $49,500 | $156,610 |
| 2024 | $3,084 | $191,650 | $33,000 | $158,650 |
| 2023 | $3,196 | $191,650 | $33,000 | $158,650 |
| 2022 | $3,234 | $173,080 | $33,000 | $140,080 |
| 2021 | $2,848 | $173,080 | $33,000 | $140,080 |
| 2020 | $2,668 | $155,020 | $21,450 | $133,570 |
| 2019 | $2,668 | $155,020 | $21,450 | $133,570 |
| 2018 | $2,600 | $149,460 | $21,450 | $128,010 |
| 2017 | $2,660 | $149,460 | $21,450 | $128,010 |
| 2016 | $2,488 | $149,460 | $21,450 | $128,010 |
| 2015 | $2,488 | $149,460 | $21,450 | $128,010 |
| 2014 | $2,416 | $143,890 | $21,450 | $122,440 |
Source: Public Records
Map
Nearby Homes
- 1804 Tremont St
- 1709 Clay St
- 1710 College St
- 1321 Franklin St
- 1316 Franklin St
- 406 W 12th St
- 315 W 21st St
- 927 W 14th St
- 3726 Broomfield Dr
- 2215 Franklin St
- 1223 W 19th St
- 118 W 11th St
- 1221 Catherine St
- 2316 Franklin St
- 1125 W 12th St
- 1103 State St
- 504 W Seerley Blvd
- 514 W Seerley Blvd
- 526 W 8th St
- 211 W 9th St