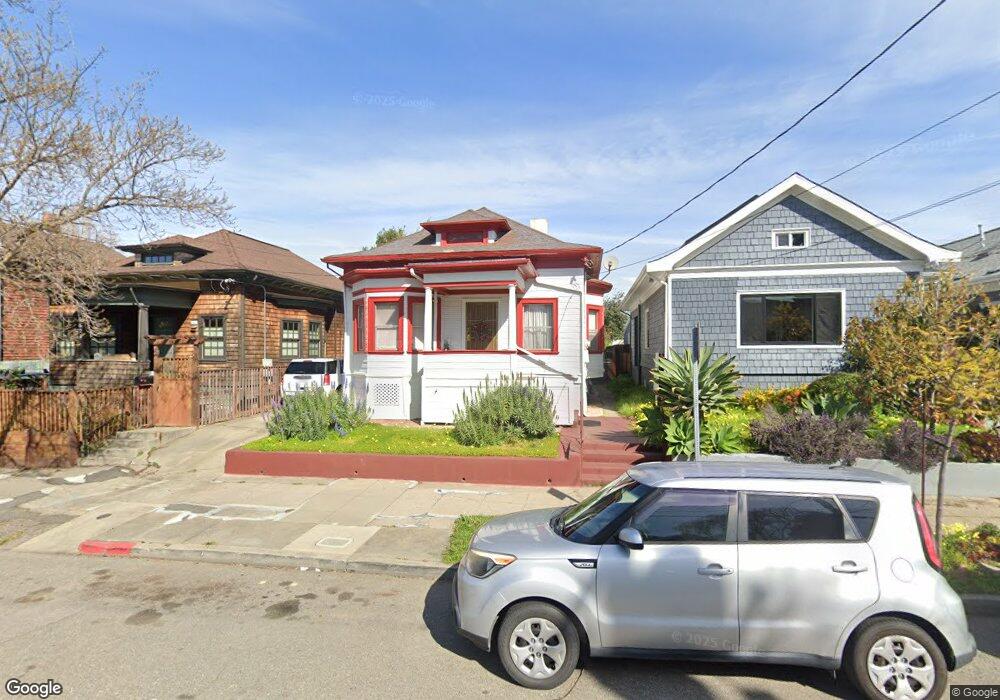
1623 62nd St Berkeley, CA 94703
South Berkeley NeighborhoodEstimated Value: $361,000 - $1,105,000
2
Beds
1
Bath
1,079
Sq Ft
$700/Sq Ft
Est. Value
About This Home
This home is located at 1623 62nd St, Berkeley, CA 94703 and is currently estimated at $755,147, approximately $699 per square foot. 1623 62nd St is a home located in Alameda County with nearby schools including Malcolm X Elementary School, Emerson Elementary School, and John Muir Elementary School.
Ownership History
Date
Name
Owned For
Owner Type
Purchase Details
Closed on
Jan 11, 2013
Sold by
Benford Kate M
Bought by
Benford Kate M
Current Estimated Value
Purchase Details
Closed on
Jun 21, 2007
Sold by
Howard Freddie Benford
Bought by
Benford Kate M
Purchase Details
Closed on
Jan 22, 2003
Sold by
Benford Fred
Bought by
Howard Freddie Benford
Create a Home Valuation Report for This Property
The Home Valuation Report is an in-depth analysis detailing your home's value as well as a comparison with similar homes in the area
Home Values in the Area
Average Home Value in this Area
Purchase History
| Date | Buyer | Sale Price | Title Company |
|---|---|---|---|
| Benford Kate M | -- | None Available | |
| Benford Kate M | $200,000 | Financial Title Company | |
| Howard Freddie Benford | -- | Financial Title Company | |
| Howard Freddie Benford | -- | -- |
Source: Public Records
Tax History
| Year | Tax Paid | Tax Assessment Tax Assessment Total Assessment is a certain percentage of the fair market value that is determined by local assessors to be the total taxable value of land and additions on the property. | Land | Improvement |
|---|---|---|---|---|
| 2025 | $4,506 | $117,808 | $56,873 | $60,935 |
| 2024 | $4,506 | $115,499 | $55,758 | $59,741 |
| 2023 | $4,338 | $113,234 | $54,665 | $58,569 |
| 2022 | $4,376 | $111,014 | $53,593 | $57,421 |
| 2021 | $4,353 | $108,837 | $52,542 | $56,295 |
| 2020 | $4,103 | $107,721 | $52,003 | $55,718 |
| 2019 | $3,897 | $105,610 | $50,984 | $54,626 |
| 2018 | $3,784 | $103,539 | $49,984 | $53,555 |
| 2017 | $3,620 | $101,509 | $49,004 | $52,505 |
| 2016 | $3,437 | $99,519 | $48,044 | $51,475 |
| 2015 | $3,366 | $98,024 | $47,322 | $50,702 |
| 2014 | $3,251 | $96,104 | $46,395 | $49,709 |
Source: Public Records
Map
Nearby Homes
- 6015 Adeline St
- 3233 Ellis St
- 3214 California St
- 3224 Sacramento St
- 5914 Martin Luther King jr Way
- 3138 California St
- 968 62nd St
- 3114 California St
- 3110 California St
- 5718 Adeline St
- 3101 Sacramento St
- 1507 Prince St
- 5812 Dover St
- 965 Arlington Ave
- 1646 Ashby Ave
- 964 57th St
- 1036 60th St
- 6300 Shattuck Ave Unit 1
- 6320 Shattuck Ave
- 6555 Shattuck Ave
Your Personal Tour Guide
Ask me questions while you tour the home.