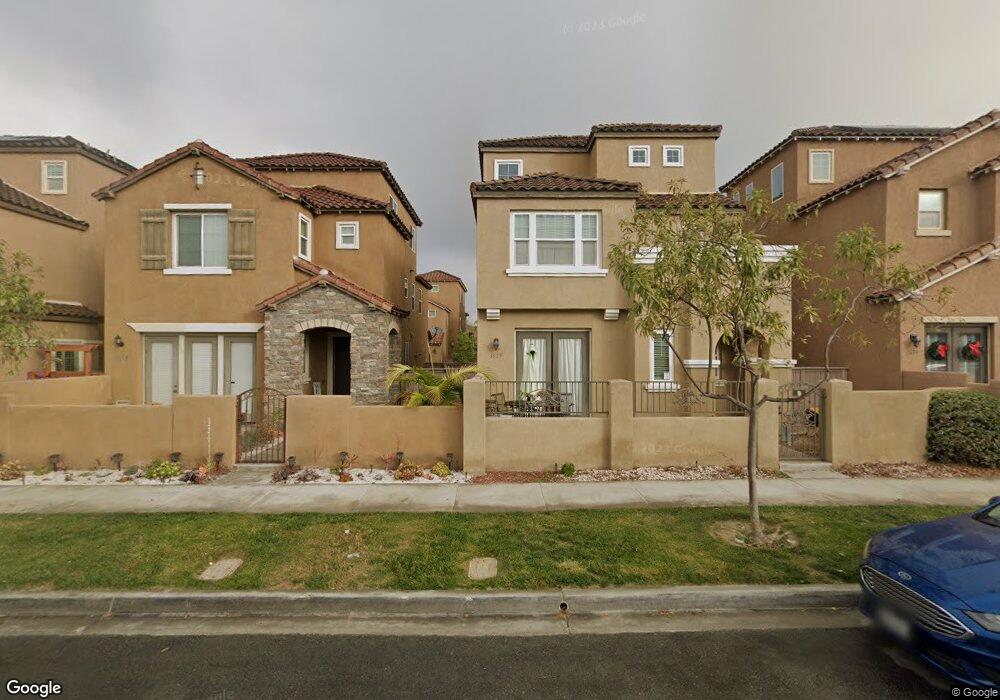
1629 Jones St Chula Vista, CA 91913
Otay Ranch NeighborhoodEstimated Value: $969,000 - $1,171,000
4
Beds
4
Baths
2,666
Sq Ft
$386/Sq Ft
Est. Value
About This Home
This home is located at 1629 Jones St, Chula Vista, CA 91913 and is currently estimated at $1,030,323, approximately $386 per square foot. 1629 Jones St is a home located in San Diego County with nearby schools including Wolf Canyon Elementary School, Rancho Del Rey Middle School, and Olympian High School.
Ownership History
Date
Name
Owned For
Owner Type
Purchase Details
Closed on
Jan 3, 2019
Sold by
Strain Lyndonna M and Strain Ewart S
Bought by
Lim Russell
Current Estimated Value
Home Financials for this Owner
Home Financials are based on the most recent Mortgage that was taken out on this home.
Original Mortgage
$546,250
Outstanding Balance
$480,265
Interest Rate
4.6%
Mortgage Type
New Conventional
Estimated Equity
$550,058
Purchase Details
Closed on
Apr 30, 2014
Sold by
Strain Ewart S and Strain Lyndonna M
Bought by
Strain Lyndonna M and Strain Ewart S
Home Financials for this Owner
Home Financials are based on the most recent Mortgage that was taken out on this home.
Original Mortgage
$480,105
Interest Rate
4.35%
Mortgage Type
VA
Purchase Details
Closed on
Mar 20, 2012
Sold by
Otay Ranch R 2B Llc
Bought by
Strain Ewart S and Strain Lyndonna M
Home Financials for this Owner
Home Financials are based on the most recent Mortgage that was taken out on this home.
Original Mortgage
$411,909
Interest Rate
3.7%
Mortgage Type
VA
Create a Home Valuation Report for This Property
The Home Valuation Report is an in-depth analysis detailing your home's value as well as a comparison with similar homes in the area
Home Values in the Area
Average Home Value in this Area
Purchase History
| Date | Buyer | Sale Price | Title Company |
|---|---|---|---|
| Lim Russell | $575,000 | Ticor Title San Diego Branch | |
| Strain Lyndonna M | -- | Stewart Title Of Ca Inc | |
| Strain Ewart S | -- | Chicago Title Company |
Source: Public Records
Mortgage History
| Date | Status | Borrower | Loan Amount |
|---|---|---|---|
| Open | Lim Russell | $546,250 | |
| Previous Owner | Strain Lyndonna M | $480,105 | |
| Previous Owner | Strain Ewart S | $411,909 |
Source: Public Records
Tax History Compared to Growth
Tax History
| Year | Tax Paid | Tax Assessment Tax Assessment Total Assessment is a certain percentage of the fair market value that is determined by local assessors to be the total taxable value of land and additions on the property. | Land | Improvement |
|---|---|---|---|---|
| 2025 | $13,103 | $641,418 | $356,964 | $284,454 |
| 2024 | $13,103 | $628,842 | $349,965 | $278,877 |
| 2023 | $12,488 | $616,512 | $343,103 | $273,409 |
| 2022 | $12,110 | $604,425 | $336,376 | $268,049 |
| 2021 | $11,839 | $592,575 | $329,781 | $262,794 |
| 2020 | $11,595 | $586,500 | $326,400 | $260,100 |
| 2019 | $9,884 | $445,132 | $121,426 | $323,706 |
| 2018 | $9,719 | $436,405 | $119,046 | $317,359 |
| 2017 | $9,536 | $427,849 | $116,712 | $311,137 |
| 2016 | $9,335 | $419,461 | $114,424 | $305,037 |
| 2015 | $9,191 | $413,162 | $112,706 | $300,456 |
| 2014 | $9,622 | $405,070 | $110,499 | $294,571 |
Source: Public Records
Map
Nearby Homes
- 1679 Kincaid Ave
- 1682 May Ave
- 1555 Tomillo Ln
- 1583 Mount Tamalpais Ave Unit 1
- 1595 Lokoya Dr
- 1566 Calle de La Flor Unit 2
- 1405 Santa Victoria Rd Unit 2
- 1423 Shearwater St Unit 1
- 1665 Santa Alexia Ave Unit 1
- 1622 Puffin Place Unit 3
- 1614 Sanderling Ave Unit 6
- 1767 Webber Way
- Residence 3 Plan at Corta Bella
- Residence 2 Plan at Corta Bella
- Residence 1 Plan at Corta Bella
- 1390 Santa Victoria Rd Unit 6
- 1531 Santa Alexia Ave
- 1362 Ortega St
- 1393 Keck Rd
- 1528 Carpinteria St