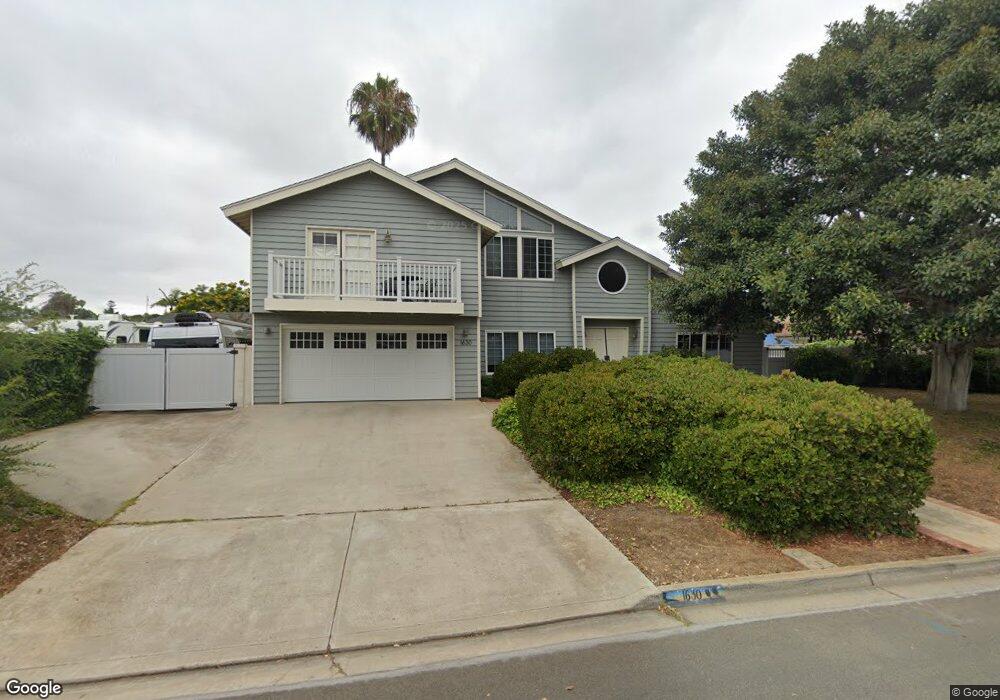
1630 Downs St Oceanside, CA 92054
Fire Mountain NeighborhoodEstimated Value: $1,474,223 - $1,622,000
3
Beds
3
Baths
2,691
Sq Ft
$579/Sq Ft
Est. Value
About This Home
This home is located at 1630 Downs St, Oceanside, CA 92054 and is currently estimated at $1,558,806, approximately $579 per square foot. 1630 Downs St is a home located in San Diego County with nearby schools including Palmquist Elementary School, Lincoln Middle School, and Oceanside High School.
Ownership History
Date
Name
Owned For
Owner Type
Purchase Details
Closed on
Jul 18, 2007
Sold by
Signer Jeffrey H and Signer Beth Goldfinger
Bought by
Signer Jeffrey H and Signer Beth S Goldfinger
Current Estimated Value
Purchase Details
Closed on
Dec 22, 1993
Sold by
Chemical Bank
Bought by
Signer Jeffrey H and Signer Beth Golfinger
Home Financials for this Owner
Home Financials are based on the most recent Mortgage that was taken out on this home.
Original Mortgage
$167,500
Interest Rate
7.21%
Purchase Details
Closed on
Nov 5, 1993
Sold by
T D Service Company
Bought by
Chemical Bank
Home Financials for this Owner
Home Financials are based on the most recent Mortgage that was taken out on this home.
Original Mortgage
$167,500
Interest Rate
7.21%
Purchase Details
Closed on
Jun 25, 1984
Create a Home Valuation Report for This Property
The Home Valuation Report is an in-depth analysis detailing your home's value as well as a comparison with similar homes in the area
Home Values in the Area
Average Home Value in this Area
Purchase History
| Date | Buyer | Sale Price | Title Company |
|---|---|---|---|
| Signer Jeffrey H | -- | None Available | |
| Signer Jeffrey H | $230,000 | Southland Title Corporation | |
| Chemical Bank | $95,000 | World Title Company | |
| -- | $46,000 | -- |
Source: Public Records
Mortgage History
| Date | Status | Borrower | Loan Amount |
|---|---|---|---|
| Closed | Signer Jeffrey H | $167,500 |
Source: Public Records
Tax History
| Year | Tax Paid | Tax Assessment Tax Assessment Total Assessment is a certain percentage of the fair market value that is determined by local assessors to be the total taxable value of land and additions on the property. | Land | Improvement |
|---|---|---|---|---|
| 2025 | $4,258 | $390,899 | $117,263 | $273,636 |
| 2024 | $4,258 | $383,235 | $114,964 | $268,271 |
| 2023 | $4,125 | $375,721 | $112,710 | $263,011 |
| 2022 | $4,062 | $368,354 | $110,500 | $257,854 |
| 2021 | $4,076 | $361,133 | $108,334 | $252,799 |
| 2020 | $3,950 | $357,431 | $107,224 | $250,207 |
| 2019 | $3,834 | $350,423 | $105,122 | $245,301 |
| 2018 | $3,792 | $343,553 | $103,061 | $240,492 |
| 2017 | $3,721 | $336,818 | $101,041 | $235,777 |
| 2016 | $3,599 | $330,214 | $99,060 | $231,154 |
| 2015 | $3,494 | $325,255 | $97,573 | $227,682 |
| 2014 | $3,358 | $318,885 | $95,662 | $223,223 |
Source: Public Records
Map
Nearby Homes
- 1520 Downs St
- 2241 California St
- 1850 Downs St
- 1782 Troy Ln
- 1535 Molly Cir
- 1765 Ivy Rd
- 1858 Avocado Rd
- 1773 Ivy Rd
- 2309 Loker Way
- 2306 Loker Way
- 2308 Loker Way
- 2312 Loker Way
- 2311 Loker Way
- 2277 Dunstan St
- 2245 Ivy Rd
- 1720 California St
- 2301 Ivy Rd
- 1355 Knoll Dr
- 1607 Hunsaker St
- 2070 Rue de la Montagne
- 1628 Downs St
- 2126 Fire Mountain Dr
- 2105 Loquat Place
- 2180 Fire Mountain Dr
- 2046 Fire Mountain Dr
- 1633 Downs St
- 2103 Loquat Place Unit B
- 1626 Downs St
- 1629 Downs St
- 2156 Fire Mountain Dr
- 1675 Avocado Rd
- 2044 Fire Mountain Dr
- 2125 Fire Mountain Dr
- 2042 Fire Mountain Dr
- 2135 Fire Mountain Dr
- 1622 Downs St
- 2102 Loquat Place
- 2108 Loquat Place
- 2043 Ups Cir
- 2083 Fire Mountain Dr
Your Personal Tour Guide
Ask me questions while you tour the home.