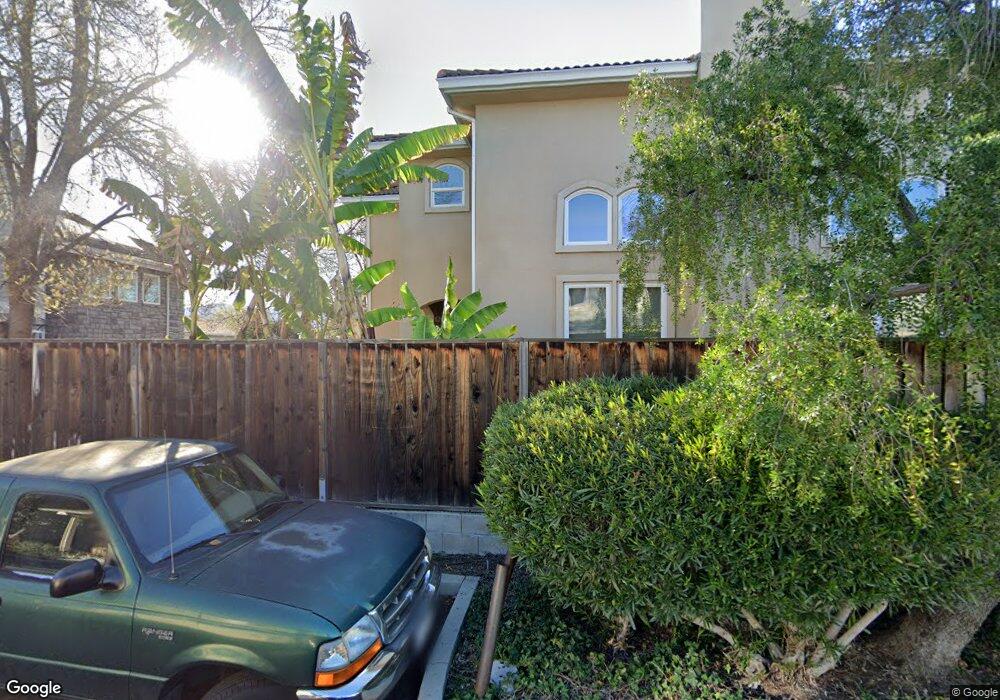
1630 White Oaks Rd Campbell, CA 95008
Estimated Value: $2,046,460 - $2,336,000
4
Beds
3
Baths
2,033
Sq Ft
$1,056/Sq Ft
Est. Value
About This Home
This home is located at 1630 White Oaks Rd, Campbell, CA 95008 and is currently estimated at $2,147,615, approximately $1,056 per square foot. 1630 White Oaks Rd is a home located in Santa Clara County with nearby schools including Leigh High School, Branham High School, and Farnham Elementary School.
Ownership History
Date
Name
Owned For
Owner Type
Purchase Details
Closed on
Jun 21, 2010
Sold by
Mok Heather Y and Mok Alen
Bought by
Mok Alen and Mok Heather Y
Current Estimated Value
Home Financials for this Owner
Home Financials are based on the most recent Mortgage that was taken out on this home.
Original Mortgage
$270,000
Interest Rate
4.91%
Mortgage Type
New Conventional
Purchase Details
Closed on
Aug 14, 1997
Sold by
Allen James Dennis and Bain Frances T
Bought by
Yamamoto Heather Y and Mok Alen
Home Financials for this Owner
Home Financials are based on the most recent Mortgage that was taken out on this home.
Original Mortgage
$315,000
Interest Rate
7.43%
Purchase Details
Closed on
Apr 18, 1997
Sold by
The E & H Third Family Ltd Partnership
Bought by
Allen James Dennis and Bain Frances T
Home Financials for this Owner
Home Financials are based on the most recent Mortgage that was taken out on this home.
Original Mortgage
$239,200
Interest Rate
3.82%
Create a Home Valuation Report for This Property
The Home Valuation Report is an in-depth analysis detailing your home's value as well as a comparison with similar homes in the area
Home Values in the Area
Average Home Value in this Area
Purchase History
| Date | Buyer | Sale Price | Title Company |
|---|---|---|---|
| Mok Alen | -- | Old Republic Title Company | |
| Yamamoto Heather Y | $350,000 | Old Republic Title Company | |
| Allen James Dennis | $300,000 | American Title Co |
Source: Public Records
Mortgage History
| Date | Status | Borrower | Loan Amount |
|---|---|---|---|
| Closed | Mok Alen | $270,000 | |
| Previous Owner | Yamamoto Heather Y | $315,000 | |
| Previous Owner | Allen James Dennis | $239,200 |
Source: Public Records
Tax History Compared to Growth
Tax History
| Year | Tax Paid | Tax Assessment Tax Assessment Total Assessment is a certain percentage of the fair market value that is determined by local assessors to be the total taxable value of land and additions on the property. | Land | Improvement |
|---|---|---|---|---|
| 2025 | $7,739 | $558,843 | $293,791 | $265,052 |
| 2024 | $7,739 | $547,886 | $288,031 | $259,855 |
| 2023 | $7,722 | $537,144 | $282,384 | $254,760 |
| 2022 | $7,606 | $526,613 | $276,848 | $249,765 |
| 2021 | $7,448 | $516,288 | $271,420 | $244,868 |
| 2020 | $7,109 | $510,995 | $268,637 | $242,358 |
| 2019 | $7,000 | $500,976 | $263,370 | $237,606 |
| 2018 | $6,780 | $491,154 | $258,206 | $232,948 |
| 2017 | $6,598 | $481,525 | $253,144 | $228,381 |
| 2016 | $7,557 | $472,084 | $248,181 | $223,903 |
| 2015 | $6,147 | $464,994 | $244,454 | $220,540 |
| 2014 | $5,966 | $455,886 | $239,666 | $216,220 |
Source: Public Records
Map
Nearby Homes
- 201 Shelley Ave
- 3659 S Bascom Ave
- 116 Monte Villa Ct
- 1500 Camden Ave
- 1178 Emerson Ave
- 3949 Starview Dr
- 14566 S Bascom Ave
- 2209 Casa Mia Dr
- 440 W Hacienda Ave
- 16157 E Mozart Ave
- 615 Chapman Dr
- 2985 Lantz Ave
- 112 Mozart Ave
- 2857 S Bascom Ave Unit 101
- 2088 Cully Place
- 2888 Lantz Ave
- 668 W Sunnyoaks Ave
- 14145 Capri Dr
- 875 Emory Ave
- 26 Timber Cove Dr Unit 26
- 1680 White Oaks Rd
- 1620 White Oaks Rd
- 61 Shelley Ave
- 55 Shelley Ave
- 39 Shelley Ave
- 69 Shelley Ave
- 67 Shelley Ave
- 1606 White Oaks Rd
- 65 Shelley Ave
- 87 Shelley Ave
- 81 Shelley Ave
- 83 Shelley Ave
- 63 Shelley Ave
- 79 Shelley Ave
- 1665 White Oaks Rd
- 1540 White Oaks Rd
- 85 Shelley Ave
- 50 Redding Rd
- 68 Redding Rd
- 75 Shelley Ave