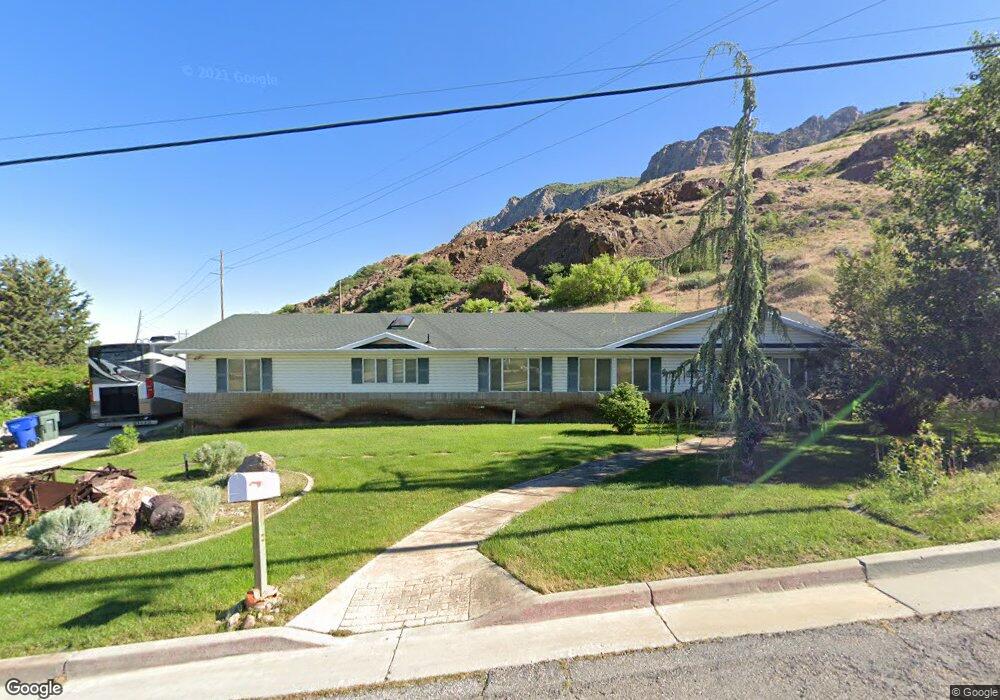
1632 9th St Ogden, UT 84404
Horace Mann NeighborhoodEstimated Value: $498,000 - $538,000
2
Beds
3
Baths
2,052
Sq Ft
$254/Sq Ft
Est. Value
About This Home
This home is located at 1632 9th St, Ogden, UT 84404 and is currently estimated at $521,825, approximately $254 per square foot. 1632 9th St is a home located in Weber County with nearby schools including Mound Fort Junior High School and Ben Lomond High School.
Ownership History
Date
Name
Owned For
Owner Type
Purchase Details
Closed on
May 9, 2000
Sold by
Rahkonen Francoise A and Rahkonen John
Bought by
Smith Robert D and Smith Melissa Sue
Current Estimated Value
Home Financials for this Owner
Home Financials are based on the most recent Mortgage that was taken out on this home.
Original Mortgage
$136,000
Outstanding Balance
$47,255
Interest Rate
8.22%
Mortgage Type
Construction
Estimated Equity
$474,570
Purchase Details
Closed on
Apr 13, 1999
Sold by
Rahkonen Francois A and Rahkonen John
Bought by
Ogden City Corp
Create a Home Valuation Report for This Property
The Home Valuation Report is an in-depth analysis detailing your home's value as well as a comparison with similar homes in the area
Home Values in the Area
Average Home Value in this Area
Purchase History
| Date | Buyer | Sale Price | Title Company |
|---|---|---|---|
| Smith Robert D | -- | U S Title | |
| Ogden City Corp | -- | -- |
Source: Public Records
Mortgage History
| Date | Status | Borrower | Loan Amount |
|---|---|---|---|
| Open | Smith Robert D | $136,000 | |
| Closed | Smith Robert D | $8,000 |
Source: Public Records
Tax History
| Year | Tax Paid | Tax Assessment Tax Assessment Total Assessment is a certain percentage of the fair market value that is determined by local assessors to be the total taxable value of land and additions on the property. | Land | Improvement |
|---|---|---|---|---|
| 2025 | $281 | $518,654 | $140,897 | $377,757 |
| 2024 | $235 | $270,049 | $77,496 | $192,553 |
| 2023 | $214 | $261,250 | $73,900 | $187,350 |
| 2022 | $3,790 | $287,101 | $60,033 | $227,068 |
| 2021 | $192 | $361,000 | $73,792 | $287,208 |
| 2020 | $189 | $293,000 | $57,140 | $235,860 |
| 2019 | $189 | $264,000 | $52,026 | $211,974 |
| 2018 | $186 | $252,000 | $52,026 | $199,974 |
| 2017 | $2,170 | $212,000 | $45,349 | $166,651 |
| 2016 | $179 | $110,927 | $21,045 | $89,882 |
| 2015 | $160 | $106,234 | $21,045 | $85,189 |
| 2014 | $153 | $87,466 | $18,202 | $69,264 |
Source: Public Records
Map
Nearby Homes
- 1565 E 775 S Unit 7
- 1528 Sunview Dr
- 994 Mountain Rd
- 572 S Elena Ln
- 1568 Hudson St Unit 1
- 1582 E Maddies Cove Unit 19
- 3270 N 3325 W Unit 386B
- 1695 E 1425 S
- 1243 Hudson St
- 1274 5th St
- 1372 Millcreek Dr Unit 8
- 1346 Millcreek Dr Unit 6
- 1453 Lewis Dr
- 1363 Lewis Dr
- 1534 Tyler Ave
- 3091 N 3075 W
- 1175 Canyon Rd Unit A21
- 1175 Canyon Rd Unit 77
- 1175 Canyon Rd Unit 80
- 1175 Canyon Rd Unit 81
- 1620 9th St
- 910 Maxfield Dr
- 905 Maxfield Dr
- 1606 9th St
- 926 Maxfield Dr
- 919 Maxfield Dr
- 910 Fillmore Ave
- 940 Maxfield Dr
- 1598 9th St
- 920 Fillmore Ave
- 931 Maxfield Dr
- 950 Maxfield Dr
- 941 Maxfield Dr
- 1592 9th St
- 905 Fillmore Ave
- 950 Fillmore Ave
- 960 Maxfield Dr
- 925 Fillmore Ave
- 951 Maxfield Dr
- 960 Stowe Dr
Your Personal Tour Guide
Ask me questions while you tour the home.