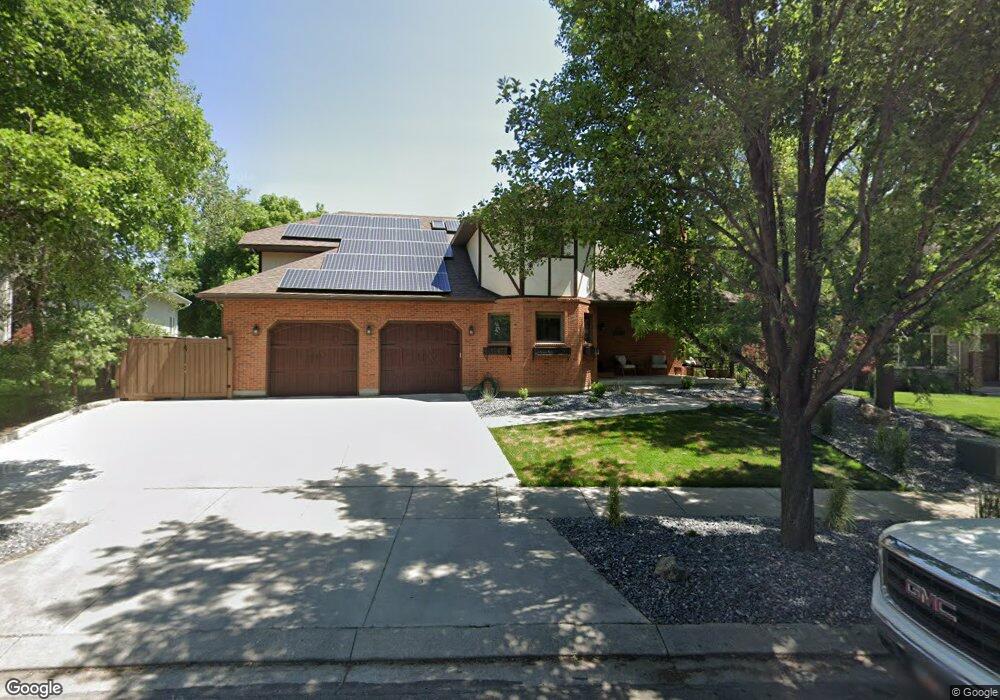
1633 Cypress Point Way Draper, UT 84020
Estimated Value: $1,113,000 - $1,466,000
4
Beds
3
Baths
5,136
Sq Ft
$249/Sq Ft
Est. Value
About This Home
This home is located at 1633 Cypress Point Way, Draper, UT 84020 and is currently estimated at $1,281,142, approximately $249 per square foot. 1633 Cypress Point Way is a home located in Salt Lake County with nearby schools including Draper Park Middle School, Corner Canyon High School, and Summit Academy - Draper Elementary Campus.
Ownership History
Date
Name
Owned For
Owner Type
Purchase Details
Closed on
Jul 17, 2023
Sold by
Passey W Lee W and Passey Joli S
Bought by
Wilson Andrew and Wilson Christina
Current Estimated Value
Home Financials for this Owner
Home Financials are based on the most recent Mortgage that was taken out on this home.
Original Mortgage
$1,045,000
Outstanding Balance
$1,020,071
Interest Rate
6.79%
Mortgage Type
New Conventional
Estimated Equity
$261,071
Purchase Details
Closed on
Mar 3, 1999
Sold by
Passey Wallace Lee and Passey Joli S
Bought by
Passey W Lee and Passey Joli S
Home Financials for this Owner
Home Financials are based on the most recent Mortgage that was taken out on this home.
Original Mortgage
$240,000
Interest Rate
6.76%
Purchase Details
Closed on
Nov 25, 1996
Sold by
Gough Construction L L C
Bought by
Passey Wallace Lee and Passey Joli S
Create a Home Valuation Report for This Property
The Home Valuation Report is an in-depth analysis detailing your home's value as well as a comparison with similar homes in the area
Home Values in the Area
Average Home Value in this Area
Purchase History
| Date | Buyer | Sale Price | Title Company |
|---|---|---|---|
| Wilson Andrew | -- | Sutherland Title Company | |
| Passey W Lee | -- | Meridian Title | |
| Passey Wallace Lee | -- | -- |
Source: Public Records
Mortgage History
| Date | Status | Borrower | Loan Amount |
|---|---|---|---|
| Open | Wilson Andrew | $1,045,000 | |
| Previous Owner | Passey W Lee | $240,000 |
Source: Public Records
Tax History Compared to Growth
Tax History
| Year | Tax Paid | Tax Assessment Tax Assessment Total Assessment is a certain percentage of the fair market value that is determined by local assessors to be the total taxable value of land and additions on the property. | Land | Improvement |
|---|---|---|---|---|
| 2025 | $5,433 | $1,090,900 | $280,600 | $810,300 |
| 2024 | $5,433 | $1,037,900 | $270,100 | $767,800 |
| 2023 | $4,833 | $916,500 | $259,700 | $656,800 |
| 2022 | $4,941 | $905,000 | $254,600 | $650,400 |
| 2021 | $4,468 | $699,000 | $221,400 | $477,600 |
| 2020 | $4,294 | $636,900 | $203,200 | $433,700 |
| 2019 | $4,359 | $631,700 | $191,700 | $440,000 |
| 2018 | $4,217 | $624,600 | $191,700 | $432,900 |
| 2017 | $4,105 | $582,400 | $191,700 | $390,700 |
| 2016 | $3,971 | $547,500 | $191,700 | $355,800 |
| 2015 | $4,290 | $547,800 | $203,200 | $344,600 |
| 2014 | $4,183 | $521,800 | $197,500 | $324,300 |
Source: Public Records
Map
Nearby Homes
- 12182 S Pine Valley Way
- 1644 Pebble Beach Cir
- 1481 Noelle Rd
- 11966 Bluff View Dr
- 2019 E Graystone Ct
- 2026 E Tivoli Hills Ct
- 11778 S 1700 E
- 11922 S Bluff View Dr
- 1612 E Hidden Valley Rd
- 11989 S Hidden Valley Dr
- 1422 E Cherry Canyon Way
- 11731 S Canberra Dr
- 1137 Parkstone Dr
- 12838 Hickory Ridge Ln
- 12671 S Somerdowns Ct
- 1937 Wasatch Blvd
- 12882 S Ellerbeck Ln Unit 12882
- 11545 S Hagan Rd
- 1143 E 11780 S
- 11415 S Hagan Rd
- 1641 E Cypress Point Way
- 1627 Cypress Point Way
- 1676 E Hidden Valley Club Dr
- 1676 Hidden Valley Club Dr
- 1664 Hidden Valley Club Dr
- 1698 E Hidden Valley Club Dr
- 1698 Hidden Valley Club Dr
- 1617 Cypress Point Way
- 1617 E Cypress Point Way
- 12187 S Cypress Point Way
- 12187 Cypress Point Way
- 1624 Cypress Point Way
- 1624 E Cypress Point Way
- 1650 Hidden Valley Club Dr
- 1694 Torrey Pines Cir
- 12168 S Cypress Point Way
- 12168 Cypress Point Way
- 1710 Hidden Valley Club Dr
- 12193 Cypress Point Way
- 12171 Cypress Point Way Unit 28