
Seller's Agent in 2026
Susan Willis
Ibis Real Estate Advisors
(619) 995-6200
11 in this area
32 Total Sales
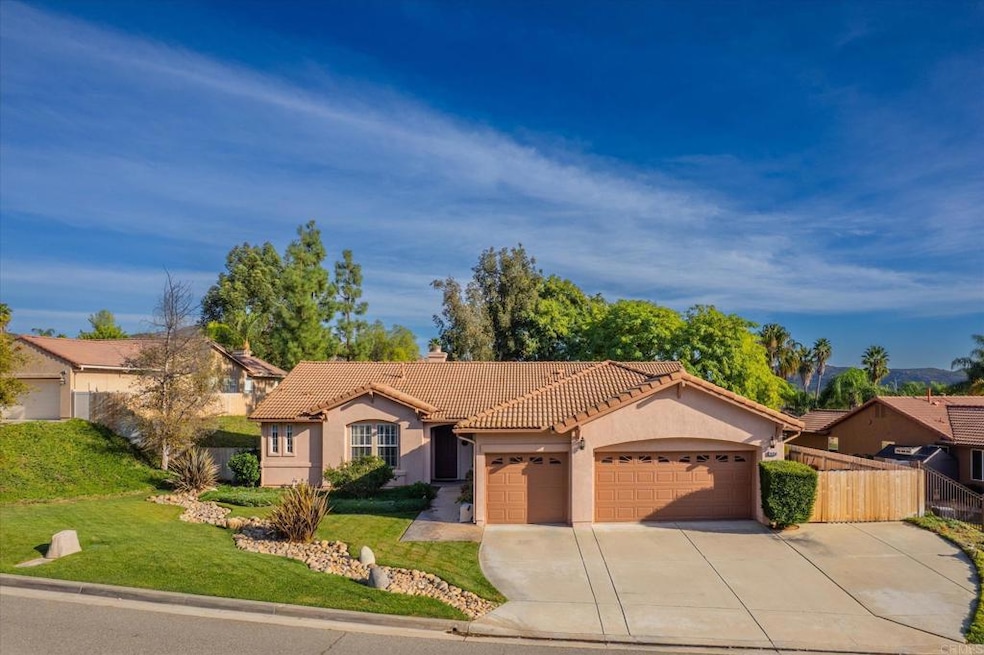
Pride of ownership, single-story Shenandoah model located in Rancho San Vicente. This 3-bedroom, 2-bathroom home offers 2,301 square feet of living space on a 0.50-acre lot, with an optional 4th bedroom and dedicated office/flex space. Interior highlights include vaulted ceilings, a remodeled kitchen with granite countertops, stainless steel appliances, dual ovens, side-by-side refrigerator, and luxury vinyl plank flooring. The primary suite offers natural light, dual closets and a soaking tub. Additional features include a wood-burning fireplace, dual-pane windows, and a 3-car garage. Backyard oasis features mature trees, lush grass, fruit trees, vinyl patio cover, built-in BBQ, and shed. Irrigation provided by a private well and RV parking. This Ryland home is near Simon Open Space Preserve and Cleveland National Forest, with award-winning Barnett Elementary School within walking distance.
Last Agent to Sell the Property
Ibis Real Estate Advisors Brokerage Email: slwrealestateinc@gmail.com License #01280545 Listed on: 11/08/2025
Co-Listed By
Molly Agee
Ibis Real Estate Advisors Brokerage Email: slwrealestateinc@gmail.com License #02146318
| Date | Type | Sale Price | Title Company |
|---|---|---|---|
| Grant Deed | $899,500 | First American Title Company | |
| Quit Claim Deed | -- | First American Title Company | |
| Quit Claim Deed | -- | -- | |
| Interfamily Deed Transfer | -- | Commonwealth Land Title Co | |
| Grant Deed | $284,500 | Lawyers Title |
| Date | Status | Loan Amount | Loan Type |
|---|---|---|---|
| Open | $669,500 | New Conventional | |
| Previous Owner | $185,700 | No Value Available | |
| Previous Owner | $189,500 | No Value Available |
| Date | Event | Price | List to Sale | Price per Sq Ft |
|---|---|---|---|---|
| 01/12/2026 01/12/26 | Sold | $899,500 | 0.0% | $391 / Sq Ft |
| 12/04/2025 12/04/25 | Price Changed | $899,500 | -2.1% | $391 / Sq Ft |
| 11/22/2025 11/22/25 | Price Changed | $919,000 | -2.1% | $399 / Sq Ft |
| 11/08/2025 11/08/25 | For Sale | $939,000 | -- | $408 / Sq Ft |
| Year | Tax Paid | Tax Assessment Tax Assessment Total Assessment is a certain percentage of the fair market value that is determined by local assessors to be the total taxable value of land and additions on the property. | Land | Improvement |
|---|---|---|---|---|
| 2025 | $5,146 | $406,027 | $150,673 | $255,354 |
| 2024 | $5,146 | $398,067 | $147,719 | $250,348 |
| 2023 | $4,866 | $390,263 | $144,823 | $245,440 |
| 2022 | $4,992 | $382,612 | $141,984 | $240,628 |
| 2021 | $4,923 | $375,110 | $139,200 | $235,910 |
| 2020 | $4,884 | $371,265 | $137,773 | $233,492 |
| 2019 | $4,776 | $363,986 | $135,072 | $228,914 |
| 2018 | $4,658 | $356,850 | $132,424 | $224,426 |
| 2017 | $4,583 | $349,854 | $129,828 | $220,026 |
| 2016 | $4,471 | $342,995 | $127,283 | $215,712 |
| 2015 | $4,361 | $337,844 | $125,372 | $212,472 |
| 2014 | $4,230 | $331,227 | $122,917 | $208,310 |
Seller's Agent in 2026
Susan Willis
Ibis Real Estate Advisors
(619) 995-6200
11 in this area
32 Total Sales
M
Seller Co-Listing Agent in 2026
Molly Agee
Ibis Real Estate Advisors
Buyer's Agent in 2026
Lori Patenaude
RE/MAX
(619) 820-3812
22 in this area
67 Total Sales
Source: California Regional Multiple Listing Service (CRMLS)
MLS Number: NDP2510692
APN: 287-121-32
Disclaimer: Certain information contained herein is derived from information provided by parties other than Homes.com. All information provided is deemed reliable, but is not guaranteed to be accurate and should be independently verified.
![]() The multiple listing data appearing on this website, or contained in reports produced therefrom, is owned and copyrighted by California Regional Multiple Listing Service, Inc. ("CRMLS") and is protected by all applicable copyright laws. Information provided is for viewer's personal, non-commercial use and may not be used for any purpose other than to identify prospective properties the viewer may be interested in purchasing. All listing data, including but not limited to square footage and lot size is believed to be accurate, but the listing Agent, listing Broker and CRMLS and its affiliates do not warrant or guarantee such accuracy. The viewer should independently verify the listed data prior to making any decisions based on such information by personal inspection and/or contacting a real estate professional.
The multiple listing data appearing on this website, or contained in reports produced therefrom, is owned and copyrighted by California Regional Multiple Listing Service, Inc. ("CRMLS") and is protected by all applicable copyright laws. Information provided is for viewer's personal, non-commercial use and may not be used for any purpose other than to identify prospective properties the viewer may be interested in purchasing. All listing data, including but not limited to square footage and lot size is believed to be accurate, but the listing Agent, listing Broker and CRMLS and its affiliates do not warrant or guarantee such accuracy. The viewer should independently verify the listed data prior to making any decisions based on such information by personal inspection and/or contacting a real estate professional.
Based on information from California Regional Multiple Listing Service, Inc. and /or other sources. All data, including all measurements and calculations of area, is obtained from various sources and has not been, and will not be, verified by broker or MLS. All information should be independently reviewed and verified for accuracy. Properties may or may not be listed by the office/agent presenting the information
Ask me questions while you tour the home.