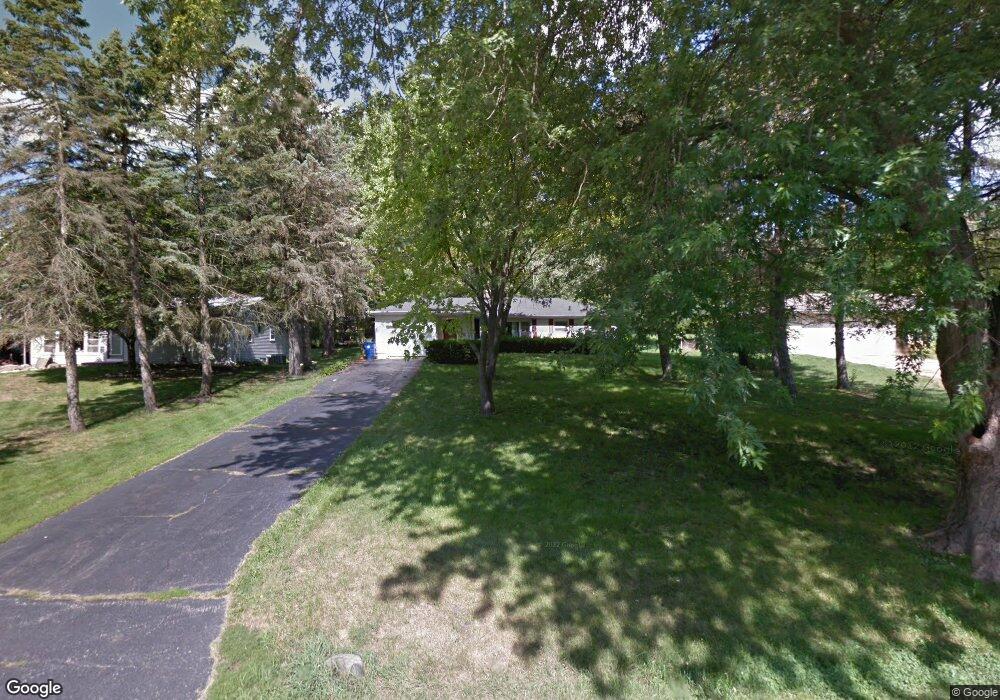
1636 Heather Dr Algonquin, IL 60102
Merrill Algonquin Hills NeighborhoodEstimated Value: $281,000 - $332,000
3
Beds
2
Baths
1,231
Sq Ft
$250/Sq Ft
Est. Value
About This Home
This home is located at 1636 Heather Dr, Algonquin, IL 60102 and is currently estimated at $307,875, approximately $250 per square foot. 1636 Heather Dr is a home located in McHenry County with nearby schools including Eastview Elementary School, Algonquin Middle School, and Dundee-Crown High School.
Ownership History
Date
Name
Owned For
Owner Type
Purchase Details
Closed on
Sep 18, 2020
Sold by
Origer Daniel J and Trunda David D
Bought by
Morgan Rebecca
Current Estimated Value
Home Financials for this Owner
Home Financials are based on the most recent Mortgage that was taken out on this home.
Original Mortgage
$176,739
Interest Rate
3.25%
Mortgage Type
FHA
Purchase Details
Closed on
Nov 14, 2005
Sold by
Schramm Mary Ann and Bode Florence
Bought by
Trunda David D and Trunda Michelle A
Home Financials for this Owner
Home Financials are based on the most recent Mortgage that was taken out on this home.
Original Mortgage
$146,250
Interest Rate
6.2%
Mortgage Type
Fannie Mae Freddie Mac
Create a Home Valuation Report for This Property
The Home Valuation Report is an in-depth analysis detailing your home's value as well as a comparison with similar homes in the area
Home Values in the Area
Average Home Value in this Area
Purchase History
| Date | Buyer | Sale Price | Title Company |
|---|---|---|---|
| Morgan Rebecca | $180,000 | Attorney | |
| Trunda David D | $195,000 | Plm Title Company |
Source: Public Records
Mortgage History
| Date | Status | Borrower | Loan Amount |
|---|---|---|---|
| Previous Owner | Morgan Rebecca | $176,739 | |
| Previous Owner | Trunda David D | $146,250 |
Source: Public Records
Tax History
| Year | Tax Paid | Tax Assessment Tax Assessment Total Assessment is a certain percentage of the fair market value that is determined by local assessors to be the total taxable value of land and additions on the property. | Land | Improvement |
|---|---|---|---|---|
| 2024 | $6,040 | $90,321 | $26,753 | $63,568 |
| 2023 | $5,709 | $80,781 | $23,927 | $56,854 |
| 2022 | $4,251 | $58,927 | $19,398 | $39,529 |
| 2021 | $4,063 | $54,898 | $18,072 | $36,826 |
| 2020 | $4,453 | $52,954 | $17,432 | $35,522 |
| 2019 | $4,365 | $50,684 | $16,685 | $33,999 |
| 2018 | $4,187 | $46,821 | $15,413 | $31,408 |
| 2017 | $4,118 | $44,108 | $14,520 | $29,588 |
| 2016 | $4,079 | $41,369 | $13,618 | $27,751 |
| 2013 | -- | $47,482 | $12,703 | $34,779 |
Source: Public Records
Map
Nearby Homes
- 1439 Lowe Dr
- 1302 Cary Rd
- 9 Echowood Dr
- 1625 Powder Horn Dr
- lot 021 Route 31 Hwy
- 1730 Tanglewood Dr
- 953 Old Oak Cir
- 1188 E Algonquin Rd
- 9416 3rd Ave
- 2110 Aspen Dr
- 600 E Algonquin Rd
- 0 River Dr N Unit MRD12473279
- 3 Sunset Ln
- 1770 E Algonquin Rd
- Lot 4 b Ryan Pkwy
- 719 Webster St
- 1782 Cumberland Pkwy
- 2 Cumberland Pkwy
- 108 La Fox Dr
- 1923 Ozark Pkwy
- 1630 Heather Dr
- 1640 Heather Dr
- 1612 Heather Dr
- 1631 Short St
- 1644 Heather Dr
- 1608 Heather Dr
- 1639 Short St
- 1621 Heather Dr
- 1621 Short St
- 1615 N Harrison St
- 127 Deerpath Rd
- 117 Blackhawk Trail
- 1631 Heather Dr
- 1609 N Harrison St
- 9 La Crosse Ct
- 1643 Heather Dr
- 1562 N Harrison St
- 114 Deerpath Rd
- 1639 Heather Dr
- 1700 Heather Dr
Your Personal Tour Guide
Ask me questions while you tour the home.