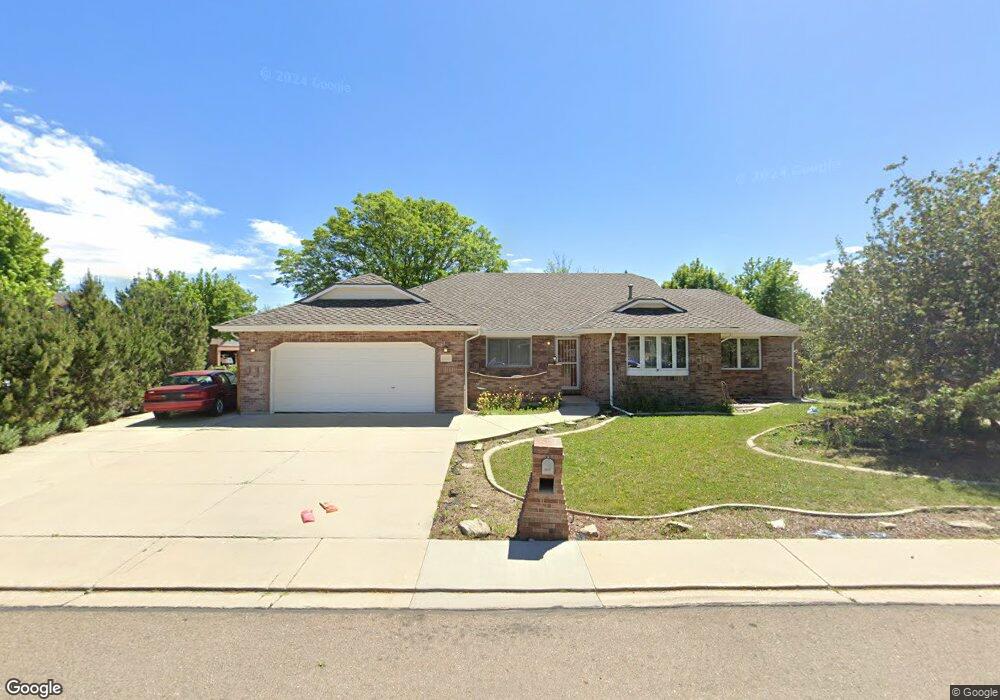
1638 Linden St Longmont, CO 80501
Loomiller NeighborhoodEstimated Value: $585,000 - $678,000
3
Beds
2
Baths
1,991
Sq Ft
$313/Sq Ft
Est. Value
About This Home
This home is located at 1638 Linden St, Longmont, CO 80501 and is currently estimated at $622,788, approximately $312 per square foot. 1638 Linden St is a home located in Boulder County with nearby schools including Mountain View Elementary School, Longs Peak Middle School, and Longmont High School.
Ownership History
Date
Name
Owned For
Owner Type
Purchase Details
Closed on
Aug 29, 2025
Sold by
Osullivan Patricia Ann and Osullivan Patricia A
Bought by
Osullivan Patricia D
Current Estimated Value
Purchase Details
Closed on
Dec 27, 1991
Bought by
Osullivan Patricia A
Purchase Details
Closed on
Sep 4, 1991
Bought by
Osullivan Patricia A
Purchase Details
Closed on
Oct 27, 1987
Bought by
Osullivan Patricia A
Purchase Details
Closed on
Oct 26, 1987
Bought by
Osullivan Patricia A
Create a Home Valuation Report for This Property
The Home Valuation Report is an in-depth analysis detailing your home's value as well as a comparison with similar homes in the area
Home Values in the Area
Average Home Value in this Area
Purchase History
| Date | Buyer | Sale Price | Title Company |
|---|---|---|---|
| Osullivan Patricia D | -- | None Listed On Document | |
| Osullivan Patricia A | $153,800 | -- | |
| Osullivan Patricia A | $32,000 | -- | |
| Osullivan Patricia A | $441,000 | -- | |
| Osullivan Patricia A | -- | -- |
Source: Public Records
Tax History Compared to Growth
Tax History
| Year | Tax Paid | Tax Assessment Tax Assessment Total Assessment is a certain percentage of the fair market value that is determined by local assessors to be the total taxable value of land and additions on the property. | Land | Improvement |
|---|---|---|---|---|
| 2025 | $3,939 | $40,357 | $6,313 | $34,044 |
| 2024 | $3,939 | $40,357 | $6,313 | $34,044 |
| 2023 | $3,253 | $41,178 | $7,035 | $37,828 |
| 2022 | $3,124 | $38,517 | $5,178 | $33,339 |
| 2021 | $3,164 | $39,626 | $5,327 | $34,299 |
| 2020 | $2,423 | $32,097 | $5,363 | $26,734 |
| 2019 | $2,385 | $32,097 | $5,363 | $26,734 |
| 2018 | $2,033 | $28,606 | $4,752 | $23,854 |
| 2017 | $2,006 | $31,625 | $5,254 | $26,371 |
| 2016 | $1,688 | $25,624 | $5,652 | $19,972 |
| 2015 | $1,609 | $22,535 | $7,164 | $15,371 |
| 2014 | $1,361 | $22,535 | $7,164 | $15,371 |
Source: Public Records
Map
Nearby Homes