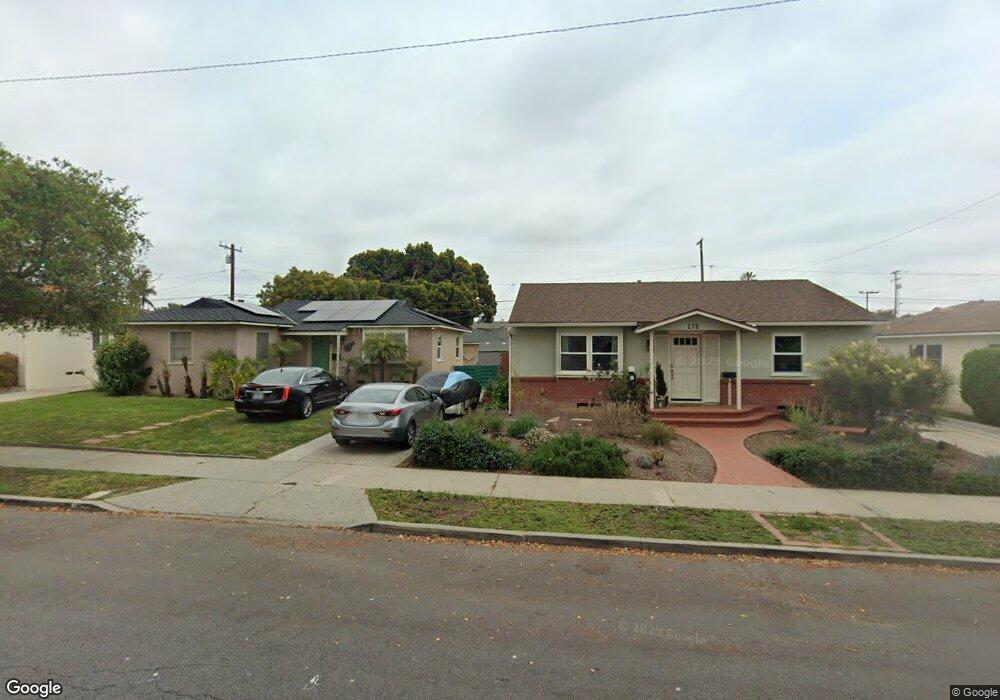
164 Jordan Ave Ventura, CA 93001
Midtown NeighborhoodEstimated Value: $655,000 - $1,073,000
4
Beds
2
Baths
1,273
Sq Ft
$682/Sq Ft
Est. Value
About This Home
This home is located at 164 Jordan Ave, Ventura, CA 93001 and is currently estimated at $868,543, approximately $682 per square foot. 164 Jordan Ave is a home located in Ventura County with nearby schools including Will Rogers Elementary School, Cabrillo Middle School, and Ventura High School.
Ownership History
Date
Name
Owned For
Owner Type
Purchase Details
Closed on
Jul 28, 2006
Sold by
Campos Louis and Strohbusch Rosalind
Bought by
Strohbusch Rosalind and Campos Louis A
Current Estimated Value
Home Financials for this Owner
Home Financials are based on the most recent Mortgage that was taken out on this home.
Original Mortgage
$282,700
Interest Rate
6.69%
Mortgage Type
New Conventional
Purchase Details
Closed on
Sep 2, 2005
Sold by
Strohbusch Rosalind and Campos Louis A
Bought by
Campos Louis A and The Louis A Campos Trust
Purchase Details
Closed on
Jul 23, 2003
Sold by
Campos Reuben and Strohbusch Rosalind
Bought by
Strohbusch Rosalind and Campos Louis A
Home Financials for this Owner
Home Financials are based on the most recent Mortgage that was taken out on this home.
Original Mortgage
$280,000
Interest Rate
5.13%
Mortgage Type
Stand Alone First
Purchase Details
Closed on
Sep 26, 2001
Sold by
Campos Margaret
Bought by
Campos Margaret A
Create a Home Valuation Report for This Property
The Home Valuation Report is an in-depth analysis detailing your home's value as well as a comparison with similar homes in the area
Home Values in the Area
Average Home Value in this Area
Purchase History
| Date | Buyer | Sale Price | Title Company |
|---|---|---|---|
| Strohbusch Rosalind | -- | First American Title Company | |
| Campos Louis | -- | First American Title Company | |
| Campos Louis A | -- | -- | |
| Strohbusch Rosalind | -- | -- | |
| Strohbusch Rosalind | $280,000 | Fidelity National Title Co | |
| Campos Margaret A | -- | -- |
Source: Public Records
Mortgage History
| Date | Status | Borrower | Loan Amount |
|---|---|---|---|
| Closed | Campos Louis | $282,700 | |
| Closed | Strohbusch Rosalind | $280,000 |
Source: Public Records
Tax History Compared to Growth
Tax History
| Year | Tax Paid | Tax Assessment Tax Assessment Total Assessment is a certain percentage of the fair market value that is determined by local assessors to be the total taxable value of land and additions on the property. | Land | Improvement |
|---|---|---|---|---|
| 2025 | $638 | $56,268 | $22,002 | $34,266 |
| 2024 | $638 | $55,165 | $21,570 | $33,595 |
| 2023 | $630 | $54,084 | $21,147 | $32,937 |
| 2022 | $593 | $53,024 | $20,732 | $32,292 |
| 2021 | $582 | $51,985 | $20,326 | $31,659 |
| 2020 | $576 | $51,454 | $20,118 | $31,336 |
| 2019 | $566 | $50,446 | $19,724 | $30,722 |
| 2018 | $557 | $49,458 | $19,338 | $30,120 |
| 2017 | $546 | $48,489 | $18,959 | $29,530 |
| 2016 | $536 | $47,539 | $18,588 | $28,951 |
| 2015 | $530 | $46,826 | $18,309 | $28,517 |
| 2014 | $521 | $45,910 | $17,951 | $27,959 |
Source: Public Records
Map
Nearby Homes
- 205 Jordan Ave
- 69 S Seaward Ave
- Plan D at Portalvo - Townhomes
- Plan F at Portalvo - Townhomes
- Plan E at Portalvo - Townhomes
- Plan O at Portalvo - Condos/Flats
- Plan A at Portalvo - Townhomes
- Plan H at Portalvo - Condos/Flats
- Plan L at Portalvo - Condos/Flats
- Plan C at Portalvo - Townhomes
- Plan B at Portalvo - Townhomes
- Plan J at Portalvo - Condos/Flats
- Plan G at Portalvo - Townhomes
- Plan N at Portalvo - Condos/Flats
- Plan K at Portalvo - Condos/Flats
- Plan M at Portalvo - Condos/Flats
- 66 San Clemente St
- 1901 Ocean Ave
- 2418 Lexington Dr
- 44 Coronado St Unit 202
- 178 Jordan Ave
- 150 Jordan Ave
- 194 Jordan Ave
- 136 Jordan Ave
- 157 S Seaward Ave
- 171 S Seaward Ave
- 147 S Seaward Ave
- 206 Jordan Ave
- 122 Jordan Ave
- 183 S Seaward Ave
- 131 S Seaward Ave
- 163 Jordan Ave
- 195 S Seaward Ave
- 177 Jordan Ave
- 149 Jordan Ave
- 127 S Seaward Ave
- 108 Jordan Ave
- 214 Jordan Ave
- 193 Jordan Ave
- 135 Jordan Ave