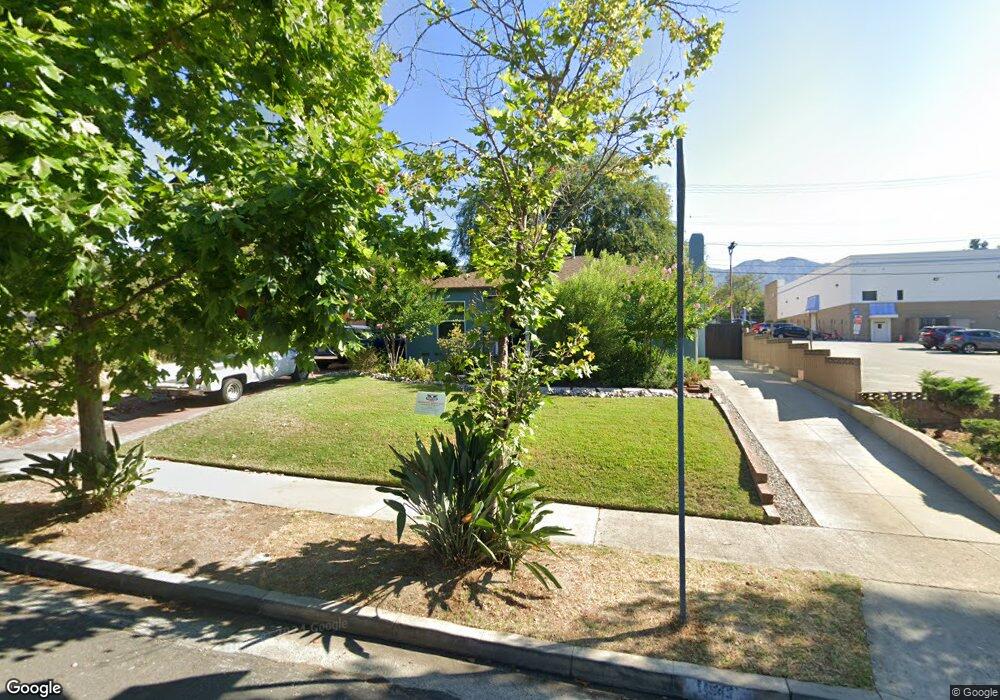
1643 Broadview Dr Glendale, CA 91208
Sparr Heights NeighborhoodEstimated Value: $1,155,109 - $1,320,000
About This Home
This home is located at 1643 Broadview Dr, Glendale, CA 91208 and is currently estimated at $1,233,777, approximately $1,166 per square foot. 1643 Broadview Dr is a home located in Los Angeles County with nearby schools including John C. Fremont Elementary School, Rosemont Middle School, and Crescenta Valley High School.
Ownership History
We collect this data history from publicly available records. To have your information removed, we recommend requesting removal directly through your county’s website.
Purchase Details
Purchase Details
Home Financials for this Owner
Home Financials are based on the most recent Mortgage that was taken out on this home.Purchase Details
Purchase Details
Home Financials for this Owner
Home Financials are based on the most recent Mortgage that was taken out on this home.Purchase Details
Home Values in the Area
Average Home Value in this Area
Purchase History
We collect this data history from publicly available records. To have your information removed, we recommend requesting removal directly through your county’s website.
| Date | Buyer | Sale Price | Title Company |
|---|---|---|---|
| -- | None Listed On Document | ||
| $855,000 | Chicago Title | ||
| $775,000 | Chicago Title Company | ||
| $179,000 | Old Republic Title Company | ||
| -- | -- |
Mortgage History
We collect this data history from publicly available records. To have your information removed, we recommend requesting removal directly through your county’s website.
| Date | Status | Borrower | Loan Amount |
|---|---|---|---|
| Previous Owner | $641,250 | ||
| Previous Owner | $143,200 |
Tax History
We collect this data history from publicly available records. To have your information removed, we recommend requesting removal directly through your county’s website.
| Year | Tax Paid | Tax Assessment Tax Assessment Total Assessment is a certain percentage of the fair market value that is determined by local assessors to be the total taxable value of land and additions on the property. | Land | Improvement |
|---|---|---|---|---|
| 2025 | $10,358 | $935,063 | $748,052 | $187,011 |
| 2024 | $10,157 | $916,730 | $733,385 | $183,345 |
| 2023 | $9,925 | $898,755 | $719,005 | $179,750 |
| 2022 | $9,752 | $881,133 | $704,907 | $176,226 |
| 2021 | $9,589 | $863,857 | $691,086 | $172,771 |
| 2020 | $8,585 | $775,000 | $620,000 | $155,000 |
| 2019 | $3,060 | $266,553 | $193,742 | $72,811 |
| 2018 | $2,960 | $261,328 | $189,944 | $71,384 |
| 2016 | $2,818 | $251,182 | $182,569 | $68,613 |
| 2015 | $2,762 | $247,410 | $179,827 | $67,583 |
| 2014 | $2,745 | $242,565 | $176,305 | $66,260 |
Map
- 2359 Mira Vista Ave Unit F
- 3651 Roselawn Ave
- 2345 Montrose Ave Unit 2
- 4136 Ocean View Blvd
- 2101 Glenada Ave Unit 2
- 2608 Honolulu Ave Unit 208
- 3481 Stancrest Dr Unit 237
- 3435 Oakmont View Dr
- 2123 Crescent Ave
- 2716 Honolulu Ave Unit 110
- 3417 Oakmont View Dr
- 2710 Piedmont Ave Unit 23
- 3226 Menlo Dr
- 2434 Prospect Ave
- 3426 Ayars Canyon Way
- 4479 Rockland Place
- 4337 Vista Place
- 4430 Rosebank Dr
- 4439 Ocean View Blvd
- 3282 Beaudry Terrace
- 1639 Broadview Dr
- 1635 Broadview Dr
- 3609 Buena Vista Ave
- 3616 Rosemary Ave
- 1627 Broadview Dr
- 1705 Broadview Dr
- 3605 Buena Vista Ave
- 3608 Rosemary Ave
- 1623 Broadview Dr
- 1700 Broadview Dr
- 3601 Buena Vista Ave
- 3604 Rosemary Ave
- 1621 Broadview Dr
- 3600 Rosemary Ave
- 3553 Buena Vista Ave
- 3552 Buena Vista Ave
- 2339 Honolulu Ave
- 1615 Broadview Dr
- 3552 Rosemary Ave
- 3615 Rosemary Ave
Ask me questions while you tour the home.