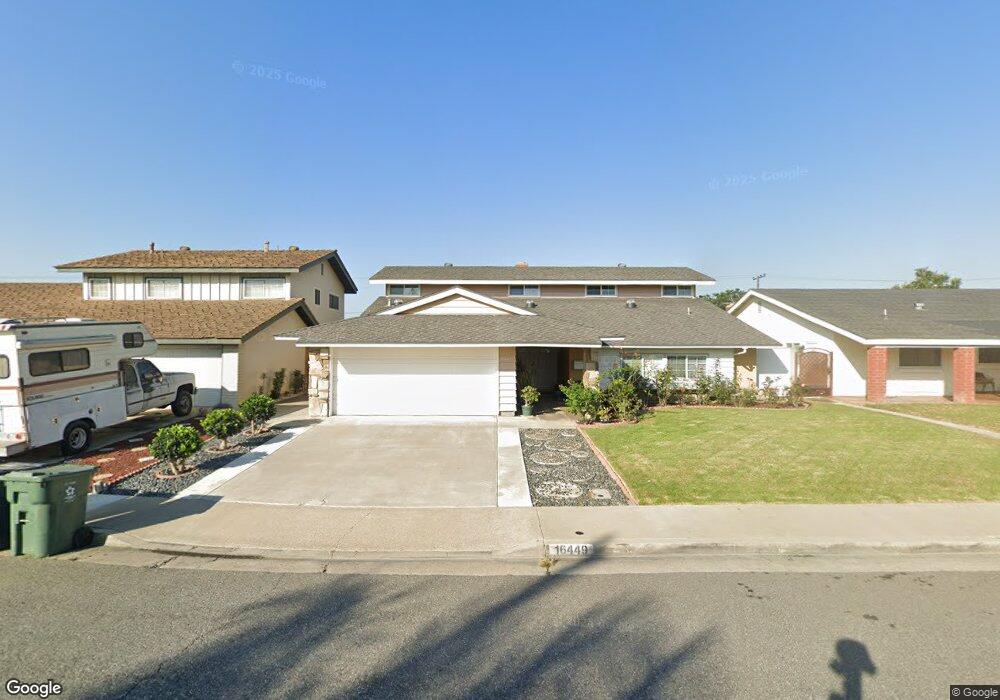
16449 Ponderosa St Fountain Valley, CA 92708
Star View NeighborhoodEstimated Value: $1,477,339 - $1,720,000
4
Beds
3
Baths
2,431
Sq Ft
$659/Sq Ft
Est. Value
About This Home
This home is located at 16449 Ponderosa St, Fountain Valley, CA 92708 and is currently estimated at $1,602,585, approximately $659 per square foot. 16449 Ponderosa St is a home located in Orange County with nearby schools including Star View Elementary, Vista View Middle School, and Ocean View High.
Ownership History
Date
Name
Owned For
Owner Type
Purchase Details
Closed on
Nov 12, 2012
Sold by
Nguyen Tan Quang and Nghiemphu Phiyen
Bought by
Nguyen Tan Quang and Nghiemphu Phiyen
Current Estimated Value
Purchase Details
Closed on
Oct 17, 2001
Sold by
Nguyen Tan Quang and Nghiemphu Phiyen
Bought by
Nguyen Tan Quang and Nghiemphu Phiyen
Home Financials for this Owner
Home Financials are based on the most recent Mortgage that was taken out on this home.
Original Mortgage
$130,000
Interest Rate
6.99%
Purchase Details
Closed on
Aug 27, 2001
Sold by
Nghiemphu Phioanh and Nguyen Tan Quang
Bought by
Nguyen Tan Quang and Nghiemphu Phiyen
Home Financials for this Owner
Home Financials are based on the most recent Mortgage that was taken out on this home.
Original Mortgage
$130,000
Interest Rate
6.99%
Purchase Details
Closed on
Jul 14, 2001
Sold by
Nghiemphu Phioanh
Bought by
Phu Phioanh Nghiem and Nghiemphu Phiyen
Home Financials for this Owner
Home Financials are based on the most recent Mortgage that was taken out on this home.
Original Mortgage
$130,000
Interest Rate
6.99%
Purchase Details
Closed on
Apr 26, 2001
Sold by
Nghiem Phi Phu and Nghiem Ngoc Suong N
Bought by
Nghiemphu Phioanh
Create a Home Valuation Report for This Property
The Home Valuation Report is an in-depth analysis detailing your home's value as well as a comparison with similar homes in the area
Home Values in the Area
Average Home Value in this Area
Purchase History
| Date | Buyer | Sale Price | Title Company |
|---|---|---|---|
| Nguyen Tan Quang | -- | None Available | |
| Nguyen Tan Quang | -- | -- | |
| Nguyen Tan Quang | -- | Stewart Title | |
| Phu Phioanh Nghiem | -- | -- | |
| Nghiemphu Phioanh | -- | -- |
Source: Public Records
Mortgage History
| Date | Status | Borrower | Loan Amount |
|---|---|---|---|
| Closed | Nguyen Tan Quang | $130,000 |
Source: Public Records
Tax History Compared to Growth
Tax History
| Year | Tax Paid | Tax Assessment Tax Assessment Total Assessment is a certain percentage of the fair market value that is determined by local assessors to be the total taxable value of land and additions on the property. | Land | Improvement |
|---|---|---|---|---|
| 2025 | $4,963 | $431,623 | $268,939 | $162,684 |
| 2024 | $4,963 | $423,160 | $263,665 | $159,495 |
| 2023 | $4,849 | $414,863 | $258,495 | $156,368 |
| 2022 | $4,777 | $406,729 | $253,427 | $153,302 |
| 2021 | $4,690 | $398,754 | $248,457 | $150,297 |
| 2020 | $4,638 | $394,666 | $245,910 | $148,756 |
| 2019 | $4,560 | $386,928 | $241,088 | $145,840 |
| 2018 | $4,459 | $379,342 | $236,361 | $142,981 |
| 2017 | $4,389 | $371,904 | $231,726 | $140,178 |
| 2016 | $4,211 | $364,612 | $227,182 | $137,430 |
| 2015 | $4,147 | $359,136 | $223,770 | $135,366 |
| 2014 | $4,066 | $352,102 | $219,387 | $132,715 |
Source: Public Records
Map
Nearby Homes
- 16551 Ross Ln
- 9446 Gardenia Ave
- 9485 Geranium Cir
- 16871 Ross Ln
- 16806 Olive St
- 16767 Madrone Cir
- 16761 Irby Ln
- 8822 Palos Verdes Ave
- 9190 Poppy Cir
- 8282 Bryant Dr
- 8841 Palos Verdes Ave
- 9801 Hibiscus Ave
- 15710 Poinsettia Way
- 16781 Scotsdale Cir
- 16379 Shadbush St
- 16102 Malaga Ln
- 17215 Buttonwood St
- 16782 Heritage Ln
- 15781 Clarendon St
- 8342 Friesland Dr
- 16437 Ponderosa St
- 16459 Ponderosa St
- 16425 Ponderosa St
- 16467 Ponderosa St
- 16442 Ponderosa St
- 16456 Ponderosa St
- 16415 Ponderosa St
- 16428 Ponderosa St
- 9036 Buttercup Ave
- 9048 Buttercup Ave
- 9065 Buttercup Ave
- 16403 Ponderosa St
- 9064 Columbine Ave
- 9060 Buttercup Ave
- 16404 Ponderosa St
- 9077 Buttercup Ave
- 16391 Ponderosa St
- 9076 Columbine Ave
- 9070 Buttercup Ave
- 16505 Magnolia St