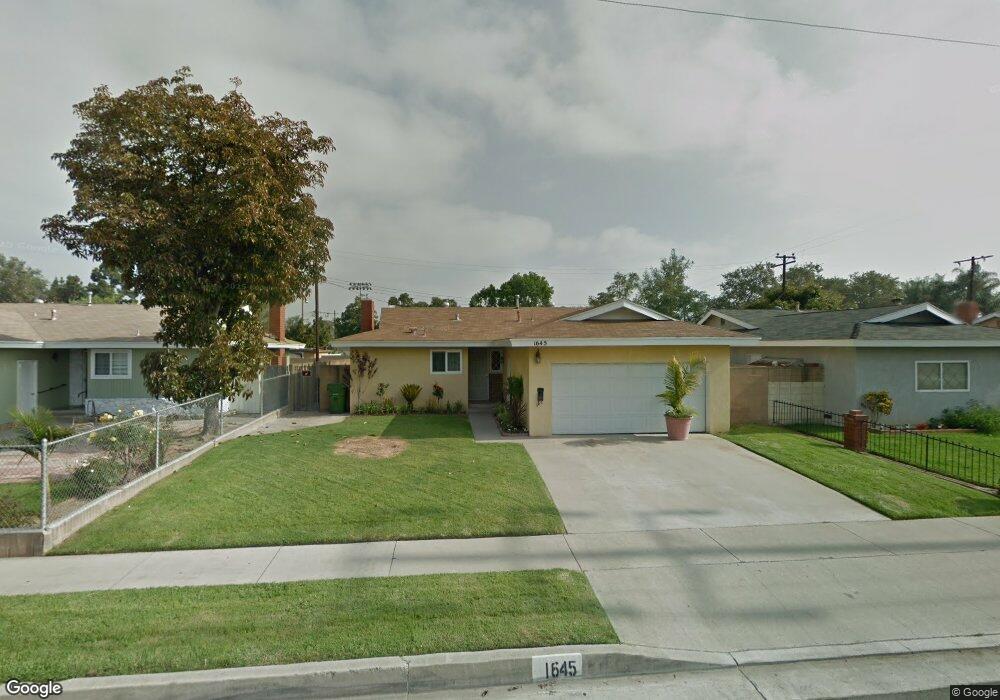
1645 E 213th St Carson, CA 90745
Estimated Value: $786,000 - $865,000
3
Beds
2
Baths
1,405
Sq Ft
$594/Sq Ft
Est. Value
About This Home
This home is located at 1645 E 213th St, Carson, CA 90745 and is currently estimated at $834,153, approximately $593 per square foot. 1645 E 213th St is a home located in Los Angeles County with nearby schools including Del Amo Elementary School, Andrew Carnegie Middle School, and Rancho Dominguez Preparatory School.
Ownership History
Date
Name
Owned For
Owner Type
Purchase Details
Closed on
Oct 24, 2016
Sold by
Ortiz Oscar A
Bought by
Ortiz Oscar A and Ortiz Veronica
Current Estimated Value
Home Financials for this Owner
Home Financials are based on the most recent Mortgage that was taken out on this home.
Original Mortgage
$315,000
Outstanding Balance
$252,692
Interest Rate
3.48%
Mortgage Type
New Conventional
Estimated Equity
$581,461
Purchase Details
Closed on
Apr 12, 2010
Sold by
The Clyde E & Clarice F Milam Family Tru
Bought by
Ortiz Oscar A and Ortiz Veronica
Home Financials for this Owner
Home Financials are based on the most recent Mortgage that was taken out on this home.
Original Mortgage
$345,349
Interest Rate
5.37%
Mortgage Type
FHA
Purchase Details
Closed on
Jun 19, 1999
Sold by
Milam Clyde E
Bought by
Milam Clyde Ellis and Milam Clarice Fay
Create a Home Valuation Report for This Property
The Home Valuation Report is an in-depth analysis detailing your home's value as well as a comparison with similar homes in the area
Home Values in the Area
Average Home Value in this Area
Purchase History
| Date | Buyer | Sale Price | Title Company |
|---|---|---|---|
| Ortiz Oscar A | -- | Pacific Coast Title | |
| Ortiz Oscar A | $350,000 | Fidelity National Title | |
| Milam Clyde Ellis | -- | -- |
Source: Public Records
Mortgage History
| Date | Status | Borrower | Loan Amount |
|---|---|---|---|
| Open | Ortiz Oscar A | $315,000 | |
| Previous Owner | Ortiz Oscar A | $345,349 |
Source: Public Records
Tax History
| Year | Tax Paid | Tax Assessment Tax Assessment Total Assessment is a certain percentage of the fair market value that is determined by local assessors to be the total taxable value of land and additions on the property. | Land | Improvement |
|---|---|---|---|---|
| 2025 | $6,135 | $451,771 | $253,509 | $198,262 |
| 2024 | $6,135 | $442,914 | $248,539 | $194,375 |
| 2023 | $6,013 | $434,230 | $243,666 | $190,564 |
| 2022 | $5,719 | $425,717 | $238,889 | $186,828 |
| 2021 | $5,648 | $417,370 | $234,205 | $183,165 |
| 2019 | $5,443 | $404,992 | $227,259 | $177,733 |
| 2018 | $5,314 | $397,052 | $222,803 | $174,249 |
| 2016 | $5,087 | $381,636 | $214,152 | $167,484 |
| 2015 | $4,987 | $375,905 | $210,936 | $164,969 |
| 2014 | $4,976 | $368,543 | $206,805 | $161,738 |
Source: Public Records
Map
Nearby Homes
- 21235 Oakfort Ave
- 1501 E Carson St Unit 7
- 1657 E 218th St
- 1502 E Carson St Unit 114
- 21900 Martin St Unit A8
- 21829 Legend Ave
- 21711 Vera St Unit 8
- 21930 Ackmar Ave
- 21992 Acarus Ave
- 1675 E Cyrene Dr
- 20317 Annalee Ave
- 1879 E Cyrene Dr
- 20002 Tajauta Ave
- 20222 Belshaw Ave
- 814 E Calbas St
- 807 E Calbas St
- 2548 E Washington St
- 20019 Belshaw Ave
- 22025 Garston Ave
- 21425 S Avalon Blvd Unit 22
- 1639 E 213th St
- 1703 E 213th St
- 1640 E Clarion Dr
- 1633 E 213th St
- 1709 E 213th St
- 21228 Pontine Ave
- 1644 E Clarion Dr
- 21231 Millpoint Ave
- 1713 E 213th St
- 1644 E 213th St
- 1640 E 213th St
- 1702 E 213th St
- 1636 E 213th St
- 21225 Millpoint Ave
- 1706 E 213th St
- 1632 E 213th St
- 1645 E Clarion Dr
- 1710 E 213th St
- 1639 E Clarion Dr
- 21221 Millpoint Ave
Your Personal Tour Guide
Ask me questions while you tour the home.