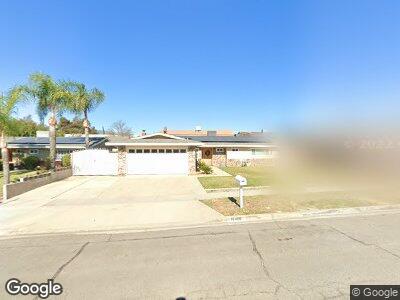
16466 Fontlee Ln Fontana, CA 92335
Estimated Value: $562,912 - $586,000
3
Beds
2
Baths
1,538
Sq Ft
$372/Sq Ft
Est. Value
About This Home
This home is located at 16466 Fontlee Ln, Fontana, CA 92335 and is currently estimated at $571,478, approximately $371 per square foot. 16466 Fontlee Ln is a home located in San Bernardino County with nearby schools including Randall Pepper Elementary School, Harry S. Truman Middle School, and Fontana High School.
Ownership History
Date
Name
Owned For
Owner Type
Purchase Details
Closed on
Mar 17, 2020
Sold by
Laatsch David W and Laatsch Amy D
Bought by
Laatsch David W and Laatsch Amy D
Current Estimated Value
Home Financials for this Owner
Home Financials are based on the most recent Mortgage that was taken out on this home.
Original Mortgage
$261,000
Interest Rate
3.4%
Mortgage Type
New Conventional
Purchase Details
Closed on
Sep 2, 2016
Sold by
Laatsch David
Bought by
Laatsch David W and Laatsch Amy D
Home Financials for this Owner
Home Financials are based on the most recent Mortgage that was taken out on this home.
Original Mortgage
$192,000
Interest Rate
3.48%
Mortgage Type
New Conventional
Purchase Details
Closed on
Dec 29, 2008
Sold by
Laatsch Amy Dyanna
Bought by
Laatsch David
Home Financials for this Owner
Home Financials are based on the most recent Mortgage that was taken out on this home.
Original Mortgage
$182,590
Interest Rate
6.03%
Mortgage Type
FHA
Purchase Details
Closed on
Nov 22, 2008
Sold by
Island Source I Llc
Bought by
Laatsch David
Home Financials for this Owner
Home Financials are based on the most recent Mortgage that was taken out on this home.
Original Mortgage
$182,590
Interest Rate
6.03%
Mortgage Type
FHA
Purchase Details
Closed on
Sep 5, 2008
Sold by
Saxon Mortgage Services Inc
Bought by
Island Source I Llc
Purchase Details
Closed on
Nov 29, 2007
Sold by
Villagomez Frank
Bought by
Saxon Mortgage Services Inc
Purchase Details
Closed on
Jan 24, 2006
Sold by
Villagomez Heather
Bought by
Villagomez Frank
Home Financials for this Owner
Home Financials are based on the most recent Mortgage that was taken out on this home.
Original Mortgage
$79,722
Interest Rate
6.08%
Mortgage Type
Stand Alone Second
Purchase Details
Closed on
Jan 9, 2006
Sold by
Davis Juming Tong
Bought by
Villagomez Frank
Home Financials for this Owner
Home Financials are based on the most recent Mortgage that was taken out on this home.
Original Mortgage
$79,722
Interest Rate
6.08%
Mortgage Type
Stand Alone Second
Purchase Details
Closed on
Nov 22, 2002
Sold by
International Church Of The Foursquare G
Bought by
Davis Juming Tong
Home Financials for this Owner
Home Financials are based on the most recent Mortgage that was taken out on this home.
Original Mortgage
$147,250
Interest Rate
5.96%
Create a Home Valuation Report for This Property
The Home Valuation Report is an in-depth analysis detailing your home's value as well as a comparison with similar homes in the area
Home Values in the Area
Average Home Value in this Area
Purchase History
| Date | Buyer | Sale Price | Title Company |
|---|---|---|---|
| Laatsch David W | -- | Lawyers Title | |
| Laatsch David W | -- | Lawyers Title Sd | |
| Laatsch David | -- | Natc | |
| Laatsch David | $185,000 | Natc | |
| Island Source I Llc | $102,000 | Natc | |
| Saxon Mortgage Services Inc | $323,000 | Alliance Title Company | |
| Villagomez Frank | -- | Ticor Title | |
| Villagomez Frank | $399,000 | Ticor Title | |
| Davis Juming Tong | $155,000 | Chicago Title Co |
Source: Public Records
Mortgage History
| Date | Status | Borrower | Loan Amount |
|---|---|---|---|
| Open | Laatsch David W | $304,000 | |
| Closed | Laatsch David W | $261,000 | |
| Closed | Laatsch David W | $265,500 | |
| Closed | Laatsch David W | $192,000 | |
| Closed | Laatsch David | $174,326 | |
| Closed | Laatsch David | $182,590 | |
| Previous Owner | Villagomez Frank | $450,000 | |
| Previous Owner | Villagomez Frank | $79,722 | |
| Previous Owner | Villagomez Frank | $318,888 | |
| Previous Owner | Davis Juming Tong | $270,000 | |
| Previous Owner | Davis Juming Tong | $147,250 |
Source: Public Records
Tax History Compared to Growth
Tax History
| Year | Tax Paid | Tax Assessment Tax Assessment Total Assessment is a certain percentage of the fair market value that is determined by local assessors to be the total taxable value of land and additions on the property. | Land | Improvement |
|---|---|---|---|---|
| 2024 | $3,276 | $233,563 | $58,390 | $175,173 |
| 2023 | $2,747 | $228,983 | $57,245 | $171,738 |
| 2022 | $2,718 | $224,494 | $56,123 | $168,371 |
| 2021 | $2,679 | $220,093 | $55,023 | $165,070 |
| 2020 | $2,658 | $217,836 | $54,459 | $163,377 |
| 2019 | $2,587 | $213,565 | $53,391 | $160,174 |
| 2018 | $2,601 | $209,377 | $52,344 | $157,033 |
| 2017 | $3,991 | $205,272 | $51,318 | $153,954 |
| 2016 | $3,896 | $201,247 | $50,312 | $150,935 |
| 2015 | $3,857 | $198,224 | $49,556 | $148,668 |
| 2014 | $2,434 | $194,341 | $48,585 | $145,756 |
Source: Public Records
Map
Nearby Homes
- 9223 Cypress Ave
- 9444 Oleander Ave
- 9614 Cypress Ave
- 16843 Fontlee Ln
- 9074 Olive St
- 8938 Date St
- 9202 Citrus Ave Unit B
- 9250 Citrus Ave Unit E
- 9208 Citrus Ave Unit C
- 9098 Sierra Ave
- 16189 Winterwood Ln
- 8916 Fontana Ave
- 9850 Cypress Ave
- 0 Holly Dr
- 16037 Athol St
- 16278 Mallory Dr
- 9358 Emerald Ave
- 16082 Athol St
- 9100 Acacia Ave Unit 9
- 9100 Acacia Ave Unit 6
- 16466 Fontlee Ln
- 16454 Fontlee Ln
- 16478 Fontlee Ln
- 16469 Tulip Ct
- 16481 Tulip Ct
- 16444 Fontlee Ln
- 16463 Tulip Ct
- 16490 Fontlee Ln
- 16467 Fontlee Ln
- 16455 Fontlee Ln
- 16471 Fontlee Ln
- 16491 Tulip Ct
- 16445 Fontlee Ln
- 16434 Fontlee Ln
- 16491 Fontlee Ln
- 16464 Tulip Ct
- 16456 Sequoia Ave
- 16466 Sequoia Ave
- 16435 Fontlee Ln
- 16482 Tulip Ct