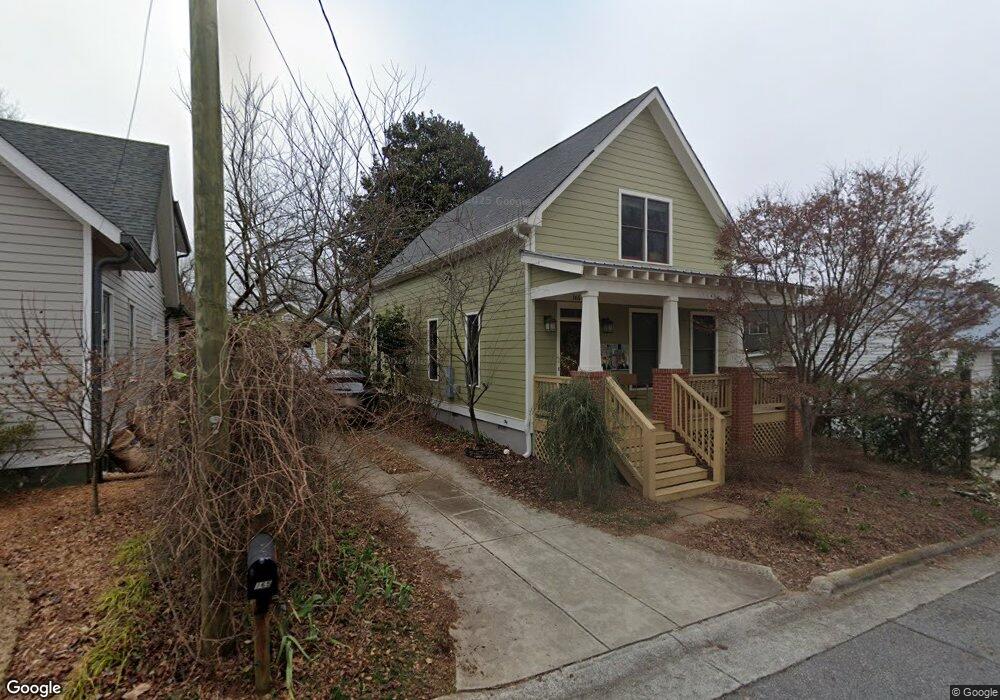
165 Cohen St Athens, GA 30601
Boulevard NeighborhoodEstimated Value: $583,000 - $703,000
--
Bed
--
Bath
1,655
Sq Ft
$390/Sq Ft
Est. Value
About This Home
This home is located at 165 Cohen St, Athens, GA 30601 and is currently estimated at $646,274, approximately $390 per square foot. 165 Cohen St is a home with nearby schools including Johnnie Lay Burks Elementary School, Clarke Middle School, and Clarke Central High School.
Ownership History
Date
Name
Owned For
Owner Type
Purchase Details
Closed on
May 15, 2024
Sold by
Schelhas John William
Bought by
Criswell Susan Gwen and Schelhas John William
Current Estimated Value
Purchase Details
Closed on
Mar 11, 2010
Sold by
Jennings William Andrew
Bought by
Schelhas John William
Purchase Details
Closed on
Mar 3, 2010
Sold by
Jennings Tommy C
Bought by
Jennings William Andrew
Purchase Details
Closed on
Feb 16, 1999
Sold by
Jennings William
Bought by
Jennings William Sr Life Estate
Create a Home Valuation Report for This Property
The Home Valuation Report is an in-depth analysis detailing your home's value as well as a comparison with similar homes in the area
Home Values in the Area
Average Home Value in this Area
Purchase History
| Date | Buyer | Sale Price | Title Company |
|---|---|---|---|
| Criswell Susan Gwen | -- | -- | |
| Schelhas John William | $91,500 | -- | |
| Jennings William Andrew | -- | -- | |
| Jennings William Andrew | -- | -- | |
| Jennings William Sr Life Estate | -- | -- |
Source: Public Records
Tax History Compared to Growth
Tax History
| Year | Tax Paid | Tax Assessment Tax Assessment Total Assessment is a certain percentage of the fair market value that is determined by local assessors to be the total taxable value of land and additions on the property. | Land | Improvement |
|---|---|---|---|---|
| 2025 | $5,405 | $251,247 | $58,500 | $192,747 |
| 2024 | $5,405 | $235,007 | $54,000 | $181,007 |
| 2023 | $5,447 | $219,391 | $49,500 | $169,891 |
| 2022 | $5,126 | $185,107 | $49,500 | $135,607 |
| 2021 | $5,232 | $171,976 | $49,500 | $122,476 |
| 2020 | $5,076 | $160,636 | $49,500 | $111,136 |
| 2019 | $4,660 | $147,247 | $45,000 | $102,247 |
| 2018 | $4,464 | $141,493 | $40,500 | $100,993 |
| 2017 | $0 | $131,864 | $40,500 | $91,364 |
| 2016 | $3,874 | $124,096 | $40,500 | $83,596 |
| 2015 | $3,703 | $118,890 | $40,500 | $78,390 |
| 2014 | $3,219 | $112,815 | $40,000 | $72,815 |
Source: Public Records
Map
Nearby Homes
- 195 Beulah Ave
- 552 Cobb St
- 570 Prince Ave
- 468 N Milledge Ave Unit 203
- 257 Hill St
- 697 Barber St
- 163 Easy St
- 480 N Billups St
- 270 Atlanta Ave
- 145 Hendrix Ave
- 1196 W Hancock Ave Unit 1
- 1198 W West Hancock Ave W
- 559 Pulaski St
- 283 King Ave
- 100 Prince Ave Unit A404
- 100 Prince Ave Unit A407
- 668 Pulaski St
- 600 Pulaski St
- 1226 W Broad St
- 100 Crestview Cir