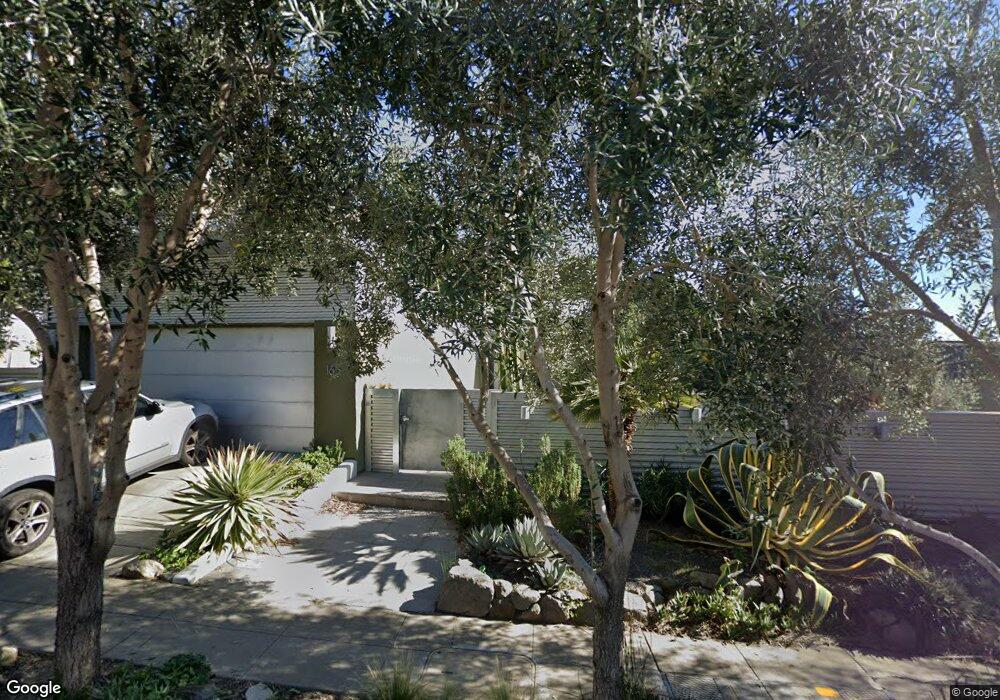
165 Vicente Rd Berkeley, CA 94705
Claremont NeighborhoodEstimated Value: $2,425,544 - $2,648,000
3
Beds
3
Baths
3,500
Sq Ft
$733/Sq Ft
Est. Value
About This Home
This home is located at 165 Vicente Rd, Berkeley, CA 94705 and is currently estimated at $2,566,386, approximately $733 per square foot. 165 Vicente Rd is a home located in Alameda County with nearby schools including John Muir Elementary School, Emerson Elementary School, and Malcolm X Elementary School.
Ownership History
Date
Name
Owned For
Owner Type
Purchase Details
Closed on
Sep 24, 2010
Sold by
Wornick Jonathan H
Bought by
Hyun Jeung S and Noles Luella
Current Estimated Value
Home Financials for this Owner
Home Financials are based on the most recent Mortgage that was taken out on this home.
Original Mortgage
$729,750
Outstanding Balance
$480,407
Interest Rate
4.38%
Mortgage Type
New Conventional
Estimated Equity
$2,085,979
Purchase Details
Closed on
May 15, 2003
Sold by
Wornick Jonathan Harrison
Bought by
Wornick Jonathan H
Purchase Details
Closed on
Sep 27, 1999
Sold by
Oneill William P and Oneill Lorelei A
Bought by
Wornick Jonathan Harrison
Purchase Details
Closed on
Jun 2, 1997
Sold by
Massey Joseph F
Bought by
Oneill William P and Oneill Lorelei A
Home Financials for this Owner
Home Financials are based on the most recent Mortgage that was taken out on this home.
Original Mortgage
$131,250
Interest Rate
8.08%
Create a Home Valuation Report for This Property
The Home Valuation Report is an in-depth analysis detailing your home's value as well as a comparison with similar homes in the area
Home Values in the Area
Average Home Value in this Area
Purchase History
| Date | Buyer | Sale Price | Title Company |
|---|---|---|---|
| Hyun Jeung S | $1,725,000 | Chicago Title Company | |
| Wornick Jonathan H | -- | Fidelity National Title | |
| Wornick Jonathan Harrison | $259,000 | Chicago Title Co | |
| Oneill William P | $175,000 | American Title Co |
Source: Public Records
Mortgage History
| Date | Status | Borrower | Loan Amount |
|---|---|---|---|
| Open | Hyun Jeung S | $729,750 | |
| Previous Owner | Oneill William P | $131,250 |
Source: Public Records
Tax History
| Year | Tax Paid | Tax Assessment Tax Assessment Total Assessment is a certain percentage of the fair market value that is determined by local assessors to be the total taxable value of land and additions on the property. | Land | Improvement |
|---|---|---|---|---|
| 2025 | $35,931 | $2,209,897 | $662,969 | $1,546,928 |
| 2024 | $35,931 | $2,166,581 | $649,974 | $1,516,607 |
| 2023 | $35,157 | $2,124,112 | $637,233 | $1,486,879 |
| 2022 | $34,463 | $2,082,471 | $624,741 | $1,457,730 |
| 2021 | $34,520 | $2,041,640 | $612,492 | $1,429,148 |
| 2020 | $32,474 | $2,020,716 | $606,215 | $1,414,501 |
| 2019 | $31,003 | $1,981,110 | $594,333 | $1,386,777 |
| 2018 | $30,447 | $1,942,280 | $582,684 | $1,359,596 |
| 2017 | $29,445 | $1,904,210 | $571,263 | $1,332,947 |
| 2016 | $28,396 | $1,866,880 | $560,064 | $1,306,816 |
| 2015 | $27,996 | $1,838,850 | $551,655 | $1,287,195 |
| 2014 | $27,527 | $1,802,831 | $540,849 | $1,261,982 |
Source: Public Records
Map
Nearby Homes
- 150 Vicente Rd
- 260 Alvarado Rd
- 142 Gravatt Dr
- 29 Live Oak Rd
- 1426 Grand View Dr
- 1488 Alvarado Rd
- 1102 Grand View Dr
- 641 Alvarado Rd
- 0 Tunnel Rd
- 0 Gravatt Dr Unit 41122154
- 2 Gravatt Dr
- 0 Dartmouth Dr
- 1215 Alvarado Rd
- 204 El Camino Real
- 7723 Claremont Ave
- 1881 Grand View Dr
- 11 Hawks Hill Ct
- 7041 Devon Way
- 190 Stonewall Rd
- 1375 Alvarado Rd
Your Personal Tour Guide
Ask me questions while you tour the home.