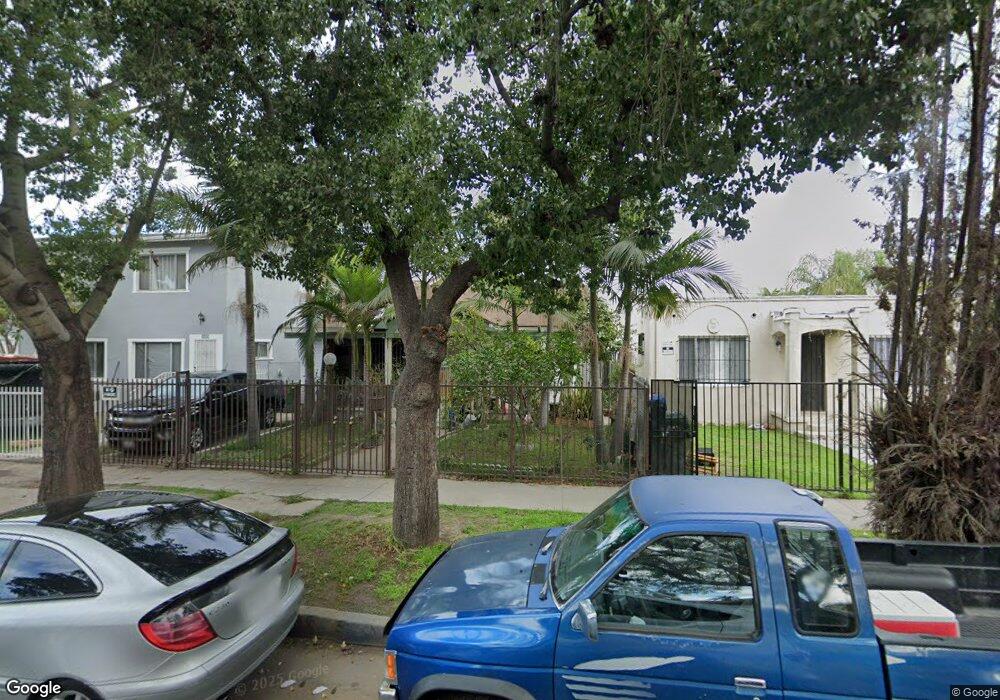
1655 W 38th Place Los Angeles, CA 90062
Exposition Park NeighborhoodEstimated Value: $733,381 - $799,000
3
Beds
1
Bath
1,310
Sq Ft
$579/Sq Ft
Est. Value
About This Home
This home is located at 1655 W 38th Place, Los Angeles, CA 90062 and is currently estimated at $758,595, approximately $579 per square foot. 1655 W 38th Place is a home located in Los Angeles County with nearby schools including Martin Luther King Jr. Elementary School, Manual Arts Senior High School, and New Heights Charter School.
Ownership History
Date
Name
Owned For
Owner Type
Purchase Details
Closed on
May 23, 2020
Sold by
Medrano Alfredo
Bought by
Medrano Alfredo and Alfredo Medrano Living Trust
Current Estimated Value
Purchase Details
Closed on
Feb 27, 2008
Sold by
Medrano Alfredo
Bought by
Medrano Alfredo
Purchase Details
Closed on
Mar 4, 2004
Sold by
Stewart Zelma Mary Farr and Stewart James Houston
Bought by
Medrano Alfredo
Home Financials for this Owner
Home Financials are based on the most recent Mortgage that was taken out on this home.
Original Mortgage
$196,000
Outstanding Balance
$91,730
Interest Rate
5.69%
Mortgage Type
Purchase Money Mortgage
Estimated Equity
$666,865
Purchase Details
Closed on
Jan 16, 2003
Sold by
Stewart James H and Stewart Zelma M
Bought by
Stewart James Houston
Purchase Details
Closed on
May 13, 1994
Sold by
Stewart Walter N
Bought by
Stewart Walter N
Create a Home Valuation Report for This Property
The Home Valuation Report is an in-depth analysis detailing your home's value as well as a comparison with similar homes in the area
Home Values in the Area
Average Home Value in this Area
Purchase History
| Date | Buyer | Sale Price | Title Company |
|---|---|---|---|
| Medrano Alfredo | -- | None Available | |
| Medrano Alfredo | -- | None Available | |
| Medrano Alfredo | $245,000 | Gateway Title Company | |
| Stewart James Houston | -- | -- | |
| Stewart Walter N | -- | -- |
Source: Public Records
Mortgage History
| Date | Status | Borrower | Loan Amount |
|---|---|---|---|
| Open | Medrano Alfredo | $196,000 | |
| Closed | Medrano Alfredo | $49,000 |
Source: Public Records
Tax History Compared to Growth
Tax History
| Year | Tax Paid | Tax Assessment Tax Assessment Total Assessment is a certain percentage of the fair market value that is determined by local assessors to be the total taxable value of land and additions on the property. | Land | Improvement |
|---|---|---|---|---|
| 2025 | $4,300 | $348,315 | $278,661 | $69,654 |
| 2024 | $4,300 | $341,487 | $273,198 | $68,289 |
| 2023 | $4,222 | $334,792 | $267,842 | $66,950 |
| 2022 | $4,034 | $328,229 | $262,591 | $65,638 |
| 2021 | $3,977 | $321,794 | $257,443 | $64,351 |
| 2019 | $3,860 | $312,252 | $249,808 | $62,444 |
| 2018 | $3,772 | $306,130 | $244,910 | $61,220 |
| 2016 | $3,598 | $294,244 | $235,400 | $58,844 |
| 2015 | $3,546 | $289,826 | $231,865 | $57,961 |
| 2014 | $3,565 | $284,150 | $227,324 | $56,826 |
Source: Public Records
Map
Nearby Homes
- 3803 S Saint Andrews Place
- 1619 W 38th St
- 1659 W 39th St
- 1619 W 39th St
- 3775 Ruthelen St
- 1821 Middleton Place
- 3720 S St Andrews Place
- 3711 S Western Ave
- 3705 S St Andrews Place
- 1782 W 36th Place
- 1726 Leighton Ave
- 3734 S Harvard Blvd
- 1723 Browning Blvd
- 1637 W 37th St
- 1572 W 37th Place
- 3702 Cimarron St
- 3877 Denker Ave
- 1929 Rochester Cir
- 1742 W 36th St
- 1597 W 37th St
- 1653 W 38th Place Unit 4
- 1653 W 38th Place
- 3814 S St Andrews Place
- 1657 W 38th Place
- 3815 S St Andrews Place
- 3810 S St Andrews Place
- 1647 W 38th Place
- 3815 S St Andrews Place
- 3811 S St Andrews Place
- 3808 S St Andrews Place
- 3807 S St Andrews Place
- 1641 W 38th Place
- 1707 W 38th Place
- 1650 W 38th St
- 1654 W 38th St
- 3804 S St Andrews Pl Place
- 3805 S Saint Andrews Place
- 3804 S St Andrews Place
- 1639 W 38th Place
- 1711 W 38th Place