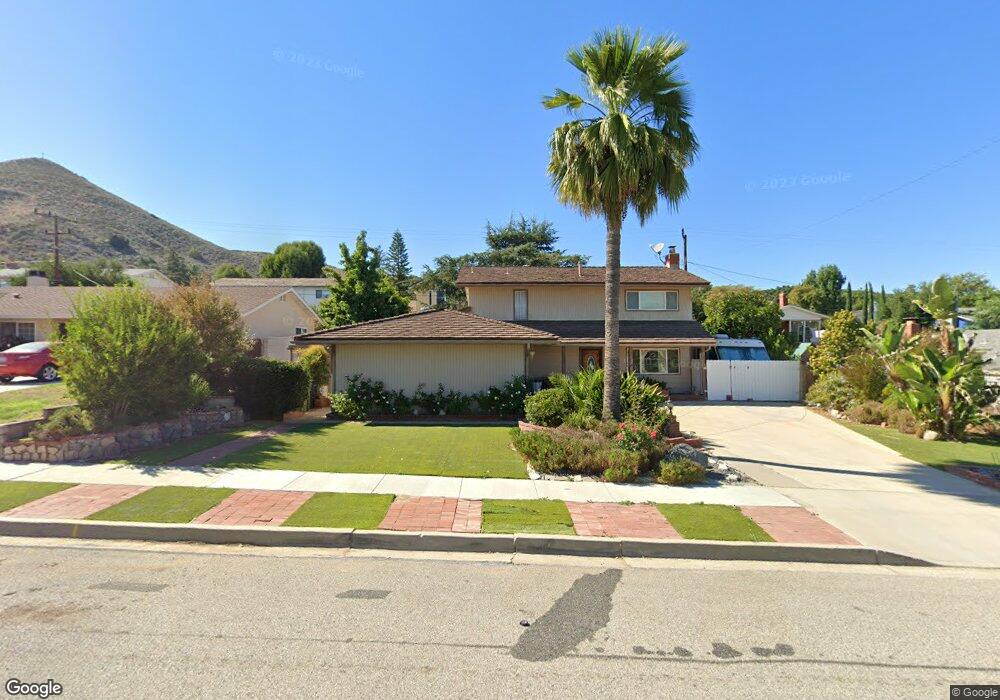
1657 Emeric Ave Simi Valley, CA 93065
West Simi Valley NeighborhoodEstimated Value: $792,628 - $959,000
4
Beds
2
Baths
1,769
Sq Ft
$502/Sq Ft
Est. Value
About This Home
This home is located at 1657 Emeric Ave, Simi Valley, CA 93065 and is currently estimated at $888,907, approximately $502 per square foot. 1657 Emeric Ave is a home located in Ventura County with nearby schools including Madera Elementary School, Sinaloa Middle School, and Royal High School.
Ownership History
Date
Name
Owned For
Owner Type
Purchase Details
Closed on
Oct 29, 2024
Sold by
Wildermuth Delayne C and Wildermuth Delayne Chandley
Bought by
Wildermuth Christopher J and Wildermuth Delayne Chandley
Current Estimated Value
Home Financials for this Owner
Home Financials are based on the most recent Mortgage that was taken out on this home.
Original Mortgage
$392,500
Outstanding Balance
$388,563
Interest Rate
6.08%
Mortgage Type
New Conventional
Estimated Equity
$500,344
Purchase Details
Closed on
Oct 14, 2024
Sold by
Chandley Family Living Trust and Chandley Scott E
Bought by
Wildermuth Delayne C
Home Financials for this Owner
Home Financials are based on the most recent Mortgage that was taken out on this home.
Original Mortgage
$392,500
Outstanding Balance
$388,563
Interest Rate
6.08%
Mortgage Type
New Conventional
Estimated Equity
$500,344
Purchase Details
Closed on
Jul 23, 1999
Sold by
Chandley Everett Jr Jacqueln and Chandley Jacquelyn L
Bought by
Chandley Everett and Chandley Jacquelyn
Create a Home Valuation Report for This Property
The Home Valuation Report is an in-depth analysis detailing your home's value as well as a comparison with similar homes in the area
Home Values in the Area
Average Home Value in this Area
Purchase History
| Date | Buyer | Sale Price | Title Company |
|---|---|---|---|
| Wildermuth Christopher J | -- | Fidelity National Title | |
| Wildermuth Delayne C | -- | None Listed On Document | |
| Chandley Everett | -- | -- |
Source: Public Records
Mortgage History
| Date | Status | Borrower | Loan Amount |
|---|---|---|---|
| Open | Wildermuth Christopher J | $392,500 |
Source: Public Records
Tax History Compared to Growth
Tax History
| Year | Tax Paid | Tax Assessment Tax Assessment Total Assessment is a certain percentage of the fair market value that is determined by local assessors to be the total taxable value of land and additions on the property. | Land | Improvement |
|---|---|---|---|---|
| 2025 | $1,745 | $494,696 | $302,086 | $192,610 |
| 2024 | $1,745 | $88,392 | $19,172 | $69,220 |
| 2023 | $1,562 | $86,659 | $18,796 | $67,863 |
| 2022 | $1,518 | $84,960 | $18,427 | $66,533 |
| 2021 | $1,473 | $83,295 | $18,066 | $65,229 |
| 2020 | $1,419 | $82,443 | $17,882 | $64,561 |
| 2019 | $1,349 | $80,828 | $17,532 | $63,296 |
| 2018 | $1,314 | $79,244 | $17,189 | $62,055 |
| 2017 | $1,267 | $77,691 | $16,852 | $60,839 |
| 2016 | $1,202 | $76,169 | $16,522 | $59,647 |
| 2015 | $1,158 | $75,027 | $16,275 | $58,752 |
| 2014 | $1,120 | $73,559 | $15,957 | $57,602 |
Source: Public Records
Map
Nearby Homes
- 76 Robbins Ct
- 42 Skyflower Ln Unit 249
- 1750 Tallowberry Ln
- 130 Farmhouse Dr Unit 2
- 1675 Tanglebush Ln
- 233 E Bonita Dr
- 114 Red Brick Dr Unit 1
- 101 Red Brick Dr Unit 5
- 151 Farmhouse Dr Unit 2
- 230 Farmhouse Dr Unit 3
- 300 Farmhouse Dr Unit 3
- 310 Farmhouse Dr Unit 4
- 1902 Winterdew Ave
- 1912 Autumnbreeze Place
- 265 Hermes St
- 252 Capri Dr
- 1008 N Country Club Dr
- 75 Vista Lago Dr
- 459 Mark Dr
- 1649 Emeric Ave
- 1669 Emeric Ave
- 1528 Los Amigos Ave
- 1550 Los Amigos Ave
- 1506 Los Amigos Ave
- 1648 Emeric Ave
- 1677 Emeric Ave
- 1641 Emeric Ave
- 1656 Emeric Ave
- 1642 Emeric Ave
- 1566 Los Amigos Ave
- 1490 Los Amigos Ave
- 1676 Emeric Ave
- 1612 Emeric Ave
- 1685 Emeric Ave
- 1527 Los Amigos Ave
- 1551 Cayton Place
- 1633 Emeric Ave
- 1529 Cayton Place
- 1416 Branch Ave