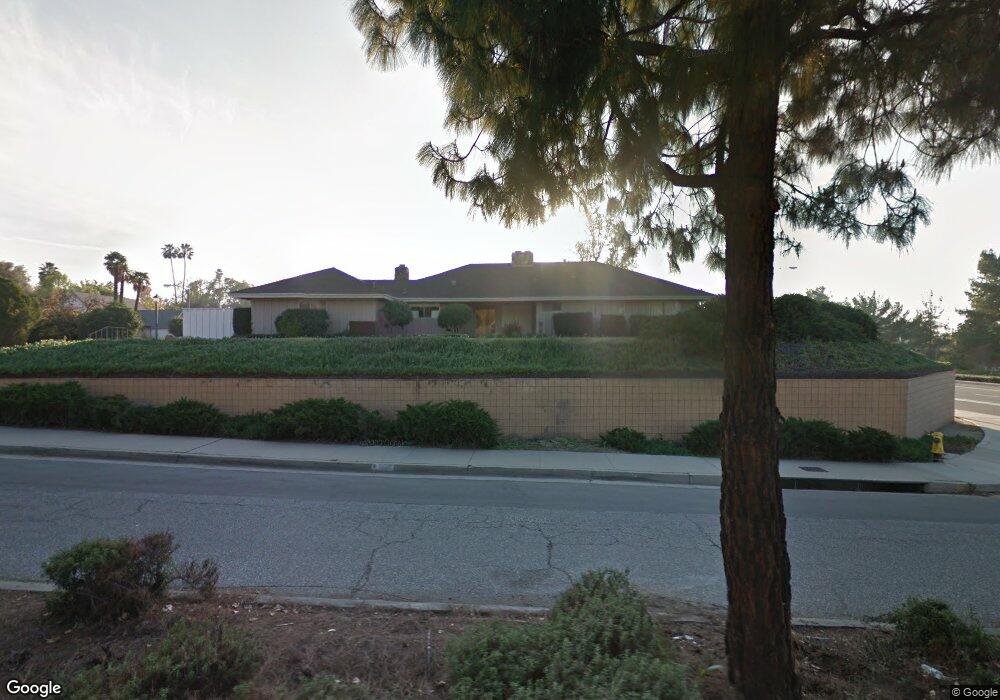
1660 Ransom Rd Riverside, CA 92506
Canyon Crest NeighborhoodEstimated Value: $640,291 - $922,000
3
Beds
2
Baths
1,644
Sq Ft
$453/Sq Ft
Est. Value
About This Home
This home is located at 1660 Ransom Rd, Riverside, CA 92506 and is currently estimated at $744,323, approximately $452 per square foot. 1660 Ransom Rd is a home located in Riverside County with nearby schools including Castle View Elementary School, Matthew Gage Middle School, and Polytechnic High School.
Create a Home Valuation Report for This Property
The Home Valuation Report is an in-depth analysis detailing your home's value as well as a comparison with similar homes in the area
Home Values in the Area
Average Home Value in this Area
Tax History
| Year | Tax Paid | Tax Assessment Tax Assessment Total Assessment is a certain percentage of the fair market value that is determined by local assessors to be the total taxable value of land and additions on the property. | Land | Improvement |
|---|---|---|---|---|
| 2025 | $1,299 | $115,753 | $31,756 | $83,997 |
| 2023 | $1,293 | $111,262 | $30,525 | $80,737 |
| 2022 | $1,269 | $109,081 | $29,927 | $79,154 |
| 2021 | $1,266 | $106,943 | $29,341 | $77,602 |
| 2020 | $1,257 | $105,848 | $29,041 | $76,807 |
| 2019 | $1,235 | $103,773 | $28,472 | $75,301 |
| 2018 | $1,212 | $101,739 | $27,914 | $73,825 |
| 2017 | $1,191 | $99,745 | $27,367 | $72,378 |
| 2016 | $1,118 | $97,790 | $26,831 | $70,959 |
| 2015 | $1,102 | $96,323 | $26,429 | $69,894 |
| 2014 | $1,091 | $94,438 | $25,912 | $68,526 |
Source: Public Records
Map
Nearby Homes
- 1420 Timberlane Dr
- 2078 Livingston St
- 5593 Malvern Way
- 1450 Via Vallarta
- 2160 Falcon Crest Dr
- 2130 Old Quarry Rd
- 5821 Sunset Ranch Dr
- 6141 Bluffwood Dr
- 2188 Ranchwood Place
- 6180 Shaker Dr
- 2216 El Capitan Dr
- 5296 Bronson Way
- 1750 Century Ave
- 6204 Claridge Dr
- 2252 El Capitan Dr
- 6282 Shaker Dr
- 2111 Elsinore Rd
- 1040 Central Ave Unit 14
- 5305 Bardwell Ave
- 1000 Central Ave Unit 8
- 5909 Intervale Dr
- 5825 Intervale Dr
- 1640 Ransom Rd
- 5915 Intervale Dr
- 5910 Intervale Dr
- 1641 Ransom Rd
- 5815 Intervale Dr
- 5914 Intervale Dr
- 5919 Intervale Dr
- 1630 Ransom Rd
- 5909 Courtland Dr
- 1631 Ransom Rd
- 5918 Intervale Dr
- 5805 Intervale Dr
- 5810 Intervale Dr
- 5919 Courtland Dr
- 5923 Intervale Dr
- 1625 Ransom Rd
- 5922 Intervale Dr
- 5715 Intervale Dr
Your Personal Tour Guide
Ask me questions while you tour the home.