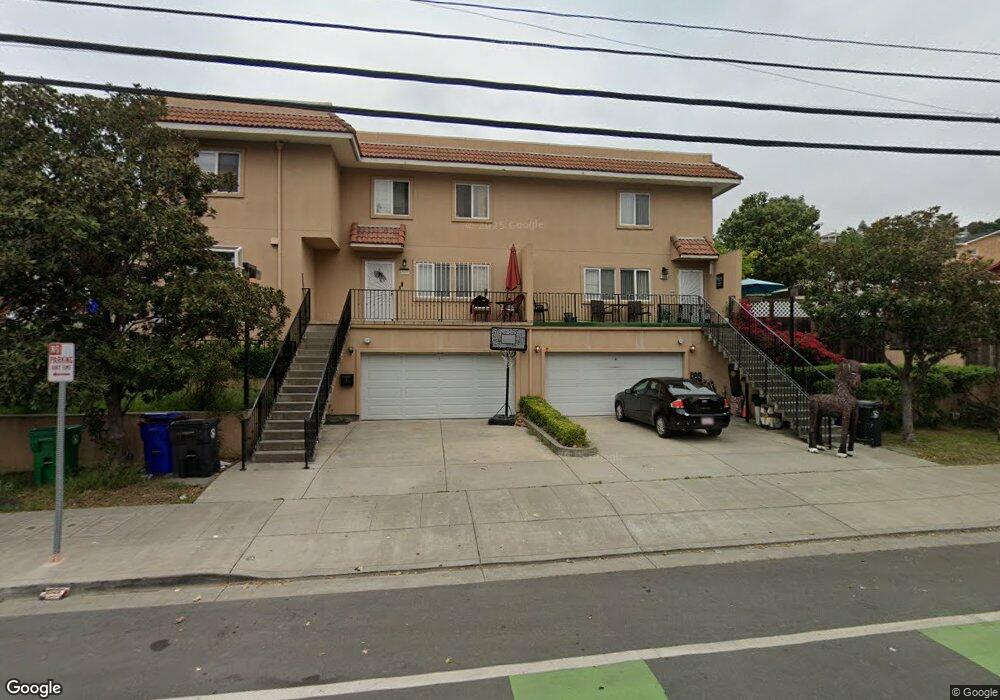
16610 Foothill Blvd San Leandro, CA 94578
West Castro Valley NeighborhoodEstimated Value: $504,000 - $541,647
3
Beds
3
Baths
1,150
Sq Ft
$455/Sq Ft
Est. Value
About This Home
This home is located at 16610 Foothill Blvd, San Leandro, CA 94578 and is currently estimated at $523,662, approximately $455 per square foot. 16610 Foothill Blvd is a home located in Alameda County with nearby schools including Corvallis Elementary School, Edendale Middle, and San Lorenzo High School.
Ownership History
Date
Name
Owned For
Owner Type
Purchase Details
Closed on
Aug 9, 2021
Sold by
Cheung Mei Kuen Karen Ng
Bought by
Cheung Mei Kuen Karen Ng and Ng Siu Kow
Current Estimated Value
Purchase Details
Closed on
Apr 22, 2014
Sold by
Cheung Mei Kuen Karen Ng
Bought by
Cheung Mei Kuen Karen Ng
Purchase Details
Closed on
Sep 24, 2012
Sold by
Ng Siu Kow Stephen
Bought by
Cheung Mei Kuen Karen Ng
Purchase Details
Closed on
Jul 5, 2012
Sold by
East West Bank
Bought by
Cheung Mei Kuenkaren Ng
Purchase Details
Closed on
Mar 28, 2011
Sold by
Dang Edmund and Tan Luis
Bought by
East West Bank
Purchase Details
Closed on
Mar 20, 2008
Sold by
Tan Criselda
Bought by
Tan Luis
Purchase Details
Closed on
Sep 19, 2005
Sold by
Pham Bao Quoc and Nguyen Karen
Bought by
Lswe Investment Inc
Create a Home Valuation Report for This Property
The Home Valuation Report is an in-depth analysis detailing your home's value as well as a comparison with similar homes in the area
Home Values in the Area
Average Home Value in this Area
Purchase History
| Date | Buyer | Sale Price | Title Company |
|---|---|---|---|
| Cheung Mei Kuen Karen Ng | -- | None Available | |
| Cheung Mei Kuen Karen Ng | -- | Pacific Coast Title Company | |
| Cheung Mei Kuen Karen Ng | -- | None Available | |
| Cheung Mei Kuenkaren Ng | $175,000 | Ticor Title | |
| East West Bank | $276,700 | Accommodation | |
| Tan Luis | -- | Liberty Title Company | |
| Lswe Investment Inc | $294,500 | United Title Company |
Source: Public Records
Tax History Compared to Growth
Tax History
| Year | Tax Paid | Tax Assessment Tax Assessment Total Assessment is a certain percentage of the fair market value that is determined by local assessors to be the total taxable value of land and additions on the property. | Land | Improvement |
|---|---|---|---|---|
| 2025 | $3,332 | $215,491 | $64,647 | $150,844 |
| 2024 | $3,332 | $211,266 | $63,380 | $147,886 |
| 2023 | $3,332 | $207,124 | $62,137 | $144,987 |
| 2022 | $3,270 | $203,064 | $60,919 | $142,145 |
| 2021 | $3,174 | $199,083 | $59,725 | $139,358 |
| 2020 | $3,096 | $197,042 | $59,112 | $137,930 |
| 2019 | $3,056 | $193,180 | $57,954 | $135,226 |
| 2018 | $2,892 | $189,393 | $56,818 | $132,575 |
| 2017 | $2,660 | $185,680 | $55,704 | $129,976 |
| 2016 | $2,685 | $182,040 | $54,612 | $127,428 |
| 2015 | $2,530 | $179,306 | $53,792 | $125,514 |
| 2014 | $2,493 | $175,794 | $52,738 | $123,056 |
Source: Public Records
Map
Nearby Homes
- 16545 Hannah Dr
- 16543 Hannah Dr
- 16860 Robey Dr
- 0 Miramonte Corner Saratoga Unit 41091854
- 16526 Page St
- 1654 164th Ave
- 16411 Saratoga St Unit 106W
- 1510 165th Ave
- 2505 Miramar Ave Unit 122
- 17220 Robey Dr
- 16560 Cowell St
- 1560 170th Ave
- 2500 Miramar Ave Unit 101
- 2500 Miramar Ave Unit 203
- 16274 San Remo Dr
- 2317 Prosperity Way
- 17324 Ehle St
- 16347 Panoramic Way
- 1530 172nd Ave
- 16557 E 14th St
- 16610 Foothill Blvd Unit 16620
- 16610 Foothill Blvd Unit 16610
- 16610 Foothill Blvd Unit 16630
- 16630 Foothill Blvd
- 1962 166th Ave
- 16607 Ehle St
- 16566 Foothill Blvd
- 16620 Foothill Blvd
- 16611 Ehle St
- 16652 Foothill Blvd
- 16615 Ehle St
- 16625 Ehle St
- 16565 Ehle St
- 16550 Foothill Blvd
- 16635 Ehle St
- 16608 Ehle St
- 16660 Foothill Blvd
- 16643 Ehle St
- 2002 166th Ave
- 16522 Foothill Blvd