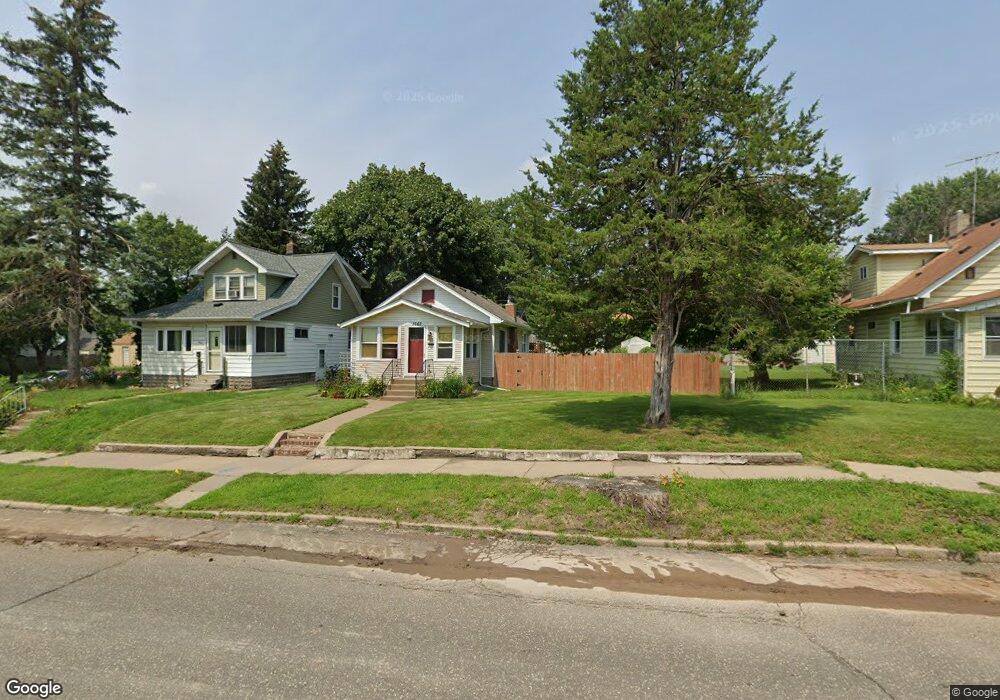
1663 Minnehaha Ave E Saint Paul, MN 55106
Hazel Park NeighborhoodEstimated Value: $210,000 - $257,000
2
Beds
2
Baths
801
Sq Ft
$286/Sq Ft
Est. Value
About This Home
This home is located at 1663 Minnehaha Ave E, Saint Paul, MN 55106 and is currently estimated at $229,028, approximately $285 per square foot. 1663 Minnehaha Ave E is a home located in Ramsey County with nearby schools including Hazel Park Preparatory Academy, Battle Creek Middle School, and Johnson Senior High School.
Ownership History
Date
Name
Owned For
Owner Type
Purchase Details
Closed on
Nov 14, 2017
Sold by
Nguyen Le Phuong Uyen and Nguyen Khoa D
Bought by
Roufs Martha
Current Estimated Value
Home Financials for this Owner
Home Financials are based on the most recent Mortgage that was taken out on this home.
Original Mortgage
$134,518
Outstanding Balance
$112,898
Interest Rate
3.91%
Mortgage Type
FHA
Estimated Equity
$116,130
Purchase Details
Closed on
Jan 16, 2014
Sold by
Boelter Robert and Boelter Michelle
Bought by
Le Phuong Uyen Nguyen
Home Financials for this Owner
Home Financials are based on the most recent Mortgage that was taken out on this home.
Original Mortgage
$101,850
Interest Rate
4.49%
Mortgage Type
New Conventional
Purchase Details
Closed on
Aug 27, 2013
Sold by
Beneficial Loan & Thrift Co
Bought by
Boelter Robert and Graupman Ross
Purchase Details
Closed on
May 8, 2003
Sold by
Bartz Beverly and Bartz Frederick
Bought by
Kendrick Sarah D
Create a Home Valuation Report for This Property
The Home Valuation Report is an in-depth analysis detailing your home's value as well as a comparison with similar homes in the area
Home Values in the Area
Average Home Value in this Area
Purchase History
| Date | Buyer | Sale Price | Title Company |
|---|---|---|---|
| Roufs Martha | $141,151 | All American Title Co | |
| Le Phuong Uyen Nguyen | $108,181 | Home Title | |
| Boelter Robert | $32,969 | First Financial Title Agency | |
| Kendrick Sarah D | $105,000 | -- |
Source: Public Records
Mortgage History
| Date | Status | Borrower | Loan Amount |
|---|---|---|---|
| Open | Roufs Martha | $134,518 | |
| Previous Owner | Le Phuong Uyen Nguyen | $101,850 |
Source: Public Records
Tax History
| Year | Tax Paid | Tax Assessment Tax Assessment Total Assessment is a certain percentage of the fair market value that is determined by local assessors to be the total taxable value of land and additions on the property. | Land | Improvement |
|---|---|---|---|---|
| 2025 | $3,316 | $224,700 | $25,000 | $199,700 |
| 2023 | $3,316 | $224,400 | $20,000 | $204,400 |
| 2022 | $2,802 | $230,500 | $20,000 | $210,500 |
| 2021 | $2,466 | $187,700 | $20,000 | $167,700 |
| 2020 | $2,388 | $173,300 | $13,800 | $159,500 |
| 2019 | $2,406 | $159,100 | $13,800 | $145,300 |
| 2018 | $2,036 | $157,800 | $13,800 | $144,000 |
| 2017 | $3,240 | $141,300 | $13,800 | $127,500 |
| 2016 | $2,144 | $0 | $0 | $0 |
| 2015 | $2,232 | $119,700 | $13,800 | $105,900 |
| 2014 | $1,100 | $0 | $0 | $0 |
Source: Public Records
Map
Nearby Homes
- 1660 Beech St
- 1708 Minnehaha Ave E
- 1704 Beech St
- 1685 Bush Ave
- 597 Flandrau St
- 1651 4th St E
- 1711 4th St E
- 1769 Ross Ave
- 1685 Fremont Ave E
- 1497 Margaret St
- 1610 Fremont Ave
- 1824 & 1822 Stillwater Ave E
- 1747 York Ave
- 935 Kennard St
- 1518 York Ave
- 1564 Case Ave
- 1824 Sims Ave
- 531 Hazel St N
- 1885 3rd St E
- 442 White Bear Ave N
- 1663 1663 Minnehaha Ave E
- 1661 Minnehaha Ave E
- 1671 Minnehaha Ave E
- 1675 1675 Minnehaha-Avenue-e
- 1675 1675 Minnehaha Ave E
- 1657 Minnehaha Ave E
- 1657 Minnehaha Ave E Unit 3
- 1664 Reaney Ave
- 1681 Minnehaha Ave E
- 1660 Reaney Ave
- 1676 Reaney Ave
- 1651 1651 Minnehaha Ave E
- 1651 Minnehaha Ave E
- 1683 Minnehaha Ave E
- 1683 1683 Minnehaha-Avenue-e
- 1683 1683 Minnehaha Ave E
- 1664 1664 Minnehaha-Avenue-e
- 1664 1664 Minnehaha Ave E
- 1664 Minnehaha Ave E
- 1662 Minnehaha Ave E
Your Personal Tour Guide
Ask me questions while you tour the home.