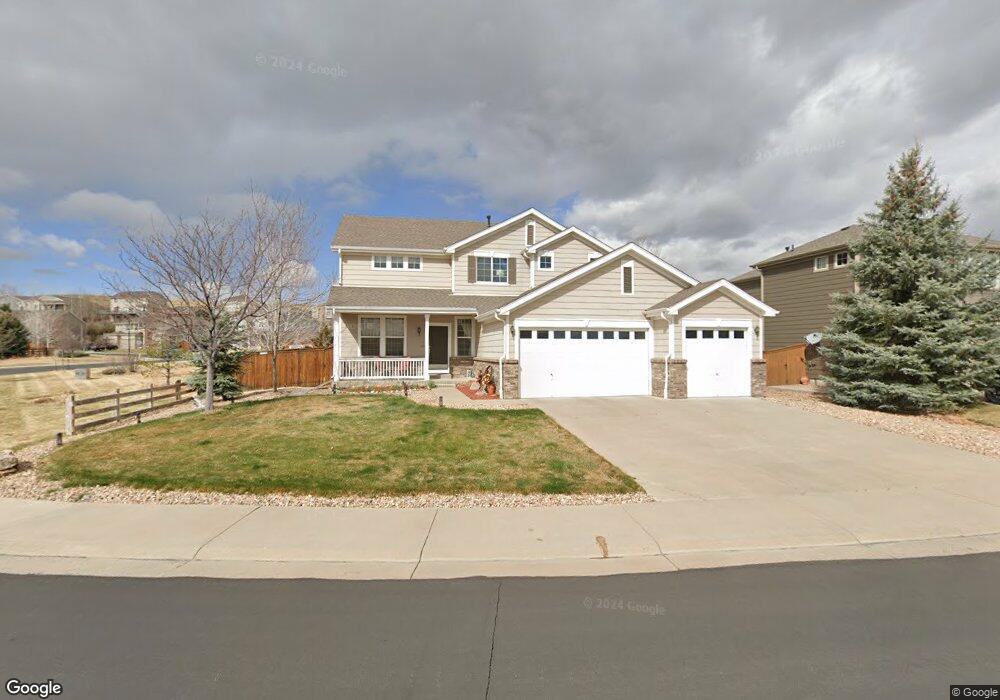
16648 Hitching Post Cir Parker, CO 80134
Bradbury Ranch NeighborhoodEstimated Value: $712,000 - $782,000
3
Beds
3
Baths
2,722
Sq Ft
$270/Sq Ft
Est. Value
About This Home
This home is located at 16648 Hitching Post Cir, Parker, CO 80134 and is currently estimated at $736,043, approximately $270 per square foot. 16648 Hitching Post Cir is a home located in Douglas County with nearby schools including Gold Rush Elementary School, Cimarron Middle School, and Legend High School.
Ownership History
Date
Name
Owned For
Owner Type
Purchase Details
Closed on
Aug 19, 2005
Sold by
Kdb Homes Inc
Bought by
Hildenbrand Philip L and Hildenbrand Dawn M
Current Estimated Value
Home Financials for this Owner
Home Financials are based on the most recent Mortgage that was taken out on this home.
Original Mortgage
$291,450
Outstanding Balance
$149,712
Interest Rate
5.61%
Mortgage Type
New Conventional
Estimated Equity
$586,331
Purchase Details
Closed on
Jun 11, 2003
Sold by
Bradbury Land Investments Llc
Bought by
Kdb Homes Inc
Purchase Details
Closed on
Feb 17, 2002
Sold by
Penrose Island Development Llc
Bought by
Bromley 132 & Cleer Creek 48 & Jpc Land
Purchase Details
Closed on
Oct 27, 2001
Sold by
Bromley 132 Llc & Clear Creek 48 Llc & C
Bought by
Bradbury Land Investment Llc
Create a Home Valuation Report for This Property
The Home Valuation Report is an in-depth analysis detailing your home's value as well as a comparison with similar homes in the area
Home Values in the Area
Average Home Value in this Area
Purchase History
| Date | Buyer | Sale Price | Title Company |
|---|---|---|---|
| Hildenbrand Philip L | $364,360 | Fahtco | |
| Kdb Homes Inc | $3,536,000 | -- | |
| Bromley 132 & Cleer Creek 48 & Jpc Land | $8,718,500 | -- | |
| Bradbury Land Investment Llc | -- | -- |
Source: Public Records
Mortgage History
| Date | Status | Borrower | Loan Amount |
|---|---|---|---|
| Open | Hildenbrand Philip L | $291,450 |
Source: Public Records
Tax History
| Year | Tax Paid | Tax Assessment Tax Assessment Total Assessment is a certain percentage of the fair market value that is determined by local assessors to be the total taxable value of land and additions on the property. | Land | Improvement |
|---|---|---|---|---|
| 2025 | $4,119 | $42,840 | $11,770 | $31,070 |
| 2024 | $4,119 | $50,840 | $10,720 | $40,120 |
| 2023 | $4,168 | $50,840 | $10,720 | $40,120 |
| 2022 | $3,280 | $37,940 | $7,140 | $30,800 |
| 2021 | $3,414 | $37,940 | $7,140 | $30,800 |
| 2020 | $3,324 | $37,550 | $8,640 | $28,910 |
| 2019 | $3,345 | $37,550 | $8,640 | $28,910 |
| 2018 | $3,106 | $33,990 | $7,830 | $26,160 |
| 2017 | $2,882 | $33,990 | $7,830 | $26,160 |
| 2016 | $2,838 | $32,850 | $7,320 | $25,530 |
| 2015 | $2,890 | $32,850 | $7,320 | $25,530 |
| 2014 | $2,530 | $25,640 | $7,320 | $18,320 |
Source: Public Records
Map
Nearby Homes
- 16685 Trail Sky Cir
- 16749 Trail Sky Cir
- 16434 E Jackalope Dr
- 11895 S Breeze Grass Way
- 12168 S Hawks Rim Trail
- 11575 Terrawood Ln
- 16046 E Flying Quail Ln
- 11662 S Maiden Hair Way
- 12223 S Grass River Trail
- 16043 E Tall Timber Ln
- 16464 E Blackthorn Way
- 16563 E Auburn Hills Dr
- 17368 Bluetrail Ave
- 11451 Whooping Crane Dr
- 17382 Bluetrail Ave
- 11387 S Blackthorn Ct
- 15790 E Windbreak Ln
- 15514 E Flower Mound Place
- 11561 S Flower Mound Way
- 11259 S Cedar Gulch Ln Unit D
- 16652 Hitching Post Cir
- 16658 Hitching Post Cir
- 16602 Hitching Post Cir
- 16645 Hitching Post Cir
- 16651 Hitching Post Cir
- 11886 Pitchfork Ct
- 16657 Hitching Post Cir
- 16600 Hitching Post Cir
- 11889 Pitchfork Ct
- 16660 Hitching Post Cir
- 11888 Pitchfork Ct
- 16663 Hitching Post Cir
- 11892 Hitching Post Trail
- 16823 Trail View Cir
- 16825 Trail View Cir
- 11889 Hitching Post Trail
- 16819 Trail View Cir
- 16817 Trail View Cir
- 16827 Trail View Cir
- 11893 Pitchfork Ct
Your Personal Tour Guide
Ask me questions while you tour the home.