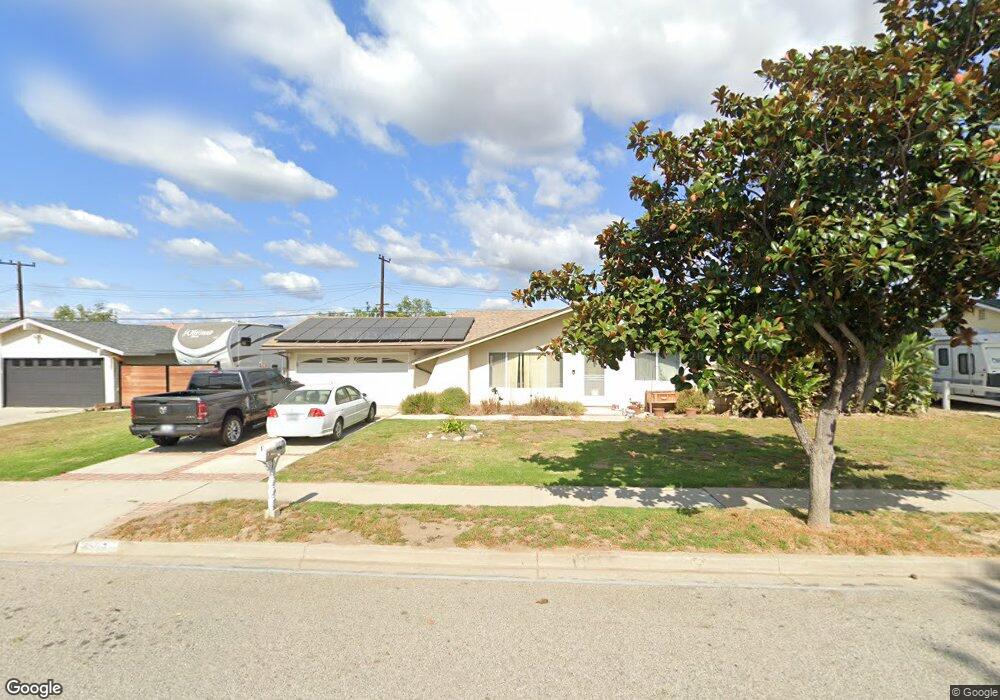
1667 Moonseed Ln Unit 230 Simi Valley, CA 93065
West Simi Valley NeighborhoodEstimated Value: $501,000 - $733,000
3
Beds
3
Baths
1,294
Sq Ft
$493/Sq Ft
Est. Value
About This Home
This home is located at 1667 Moonseed Ln Unit 230, Simi Valley, CA 93065 and is currently estimated at $638,433, approximately $493 per square foot. 1667 Moonseed Ln Unit 230 is a home located in Ventura County with nearby schools including Arroyo Elementary School, Sinaloa Middle School, and Royal High School.
Ownership History
Date
Name
Owned For
Owner Type
Purchase Details
Closed on
Mar 7, 2003
Sold by
Vanvanta Duc Van and Nguyen Dao Anh
Bought by
Vanvanta Duc Van and Nguyen Dao Anh
Current Estimated Value
Home Financials for this Owner
Home Financials are based on the most recent Mortgage that was taken out on this home.
Original Mortgage
$195,000
Outstanding Balance
$83,524
Interest Rate
5.83%
Estimated Equity
$554,909
Purchase Details
Closed on
Sep 12, 2002
Sold by
Tran Truong and Nghiem Uyen
Bought by
Vanta Duc and Nguyen Dao Anh
Home Financials for this Owner
Home Financials are based on the most recent Mortgage that was taken out on this home.
Original Mortgage
$137,450
Interest Rate
5.83%
Purchase Details
Closed on
Oct 20, 1998
Sold by
Veranda Village Llc
Bought by
Tran Truong and Nghiem Uyen
Home Financials for this Owner
Home Financials are based on the most recent Mortgage that was taken out on this home.
Original Mortgage
$111,900
Interest Rate
6.78%
Create a Home Valuation Report for This Property
The Home Valuation Report is an in-depth analysis detailing your home's value as well as a comparison with similar homes in the area
Home Values in the Area
Average Home Value in this Area
Purchase History
| Date | Buyer | Sale Price | Title Company |
|---|---|---|---|
| Vanvanta Duc Van | -- | American Title Co | |
| Vanta Duc | $172,000 | American Title Co | |
| Tran Truong | $140,000 | Investors Title Company |
Source: Public Records
Mortgage History
| Date | Status | Borrower | Loan Amount |
|---|---|---|---|
| Open | Vanvanta Duc Van | $195,000 | |
| Previous Owner | Vanta Duc | $137,450 | |
| Previous Owner | Tran Truong | $111,900 |
Source: Public Records
Tax History Compared to Growth
Tax History
| Year | Tax Paid | Tax Assessment Tax Assessment Total Assessment is a certain percentage of the fair market value that is determined by local assessors to be the total taxable value of land and additions on the property. | Land | Improvement |
|---|---|---|---|---|
| 2025 | $3,479 | $260,122 | $130,061 | $130,061 |
| 2024 | $3,479 | $255,022 | $127,511 | $127,511 |
| 2023 | $3,267 | $250,022 | $125,011 | $125,011 |
| 2022 | $3,232 | $245,120 | $122,560 | $122,560 |
| 2021 | $3,188 | $240,314 | $120,157 | $120,157 |
| 2020 | $3,108 | $237,852 | $118,926 | $118,926 |
| 2019 | $2,962 | $233,190 | $116,595 | $116,595 |
| 2018 | $2,923 | $228,618 | $114,309 | $114,309 |
| 2017 | $2,847 | $224,136 | $112,068 | $112,068 |
| 2016 | $2,713 | $219,742 | $109,871 | $109,871 |
| 2015 | $2,645 | $216,444 | $108,222 | $108,222 |
| 2014 | $2,595 | $212,206 | $106,103 | $106,103 |
Source: Public Records
Map
Nearby Homes
- 1778 Sinaloa Rd Unit 193
- 1766 Sinaloa Rd Unit 177
- 1772 Sinaloa Rd Unit 189
- 1772 Sinaloa Rd Unit 290
- 1724 Sinaloa Rd Unit 227
- 1736 Sinaloa Rd Unit 314
- 1736 Sinaloa Rd Unit 325
- 1742 Sinaloa Rd Unit 329
- 233 E Bonita Dr
- 1675 Tanglebush Ln
- 459 Mark Dr
- 300 Farmhouse Dr Unit 3
- 230 Farmhouse Dr Unit 3
- 310 Farmhouse Dr Unit 4
- 469 Aristotle St
- 151 Farmhouse Dr Unit 2
- 1750 Tallowberry Ln
- 1507 4th St
- 265 Hermes St
- 533 Mark Dr
- 1679 Moonseed Ln
- 1668 Woodscent Ln
- 1655 Moonseed Ln
- 1678 Woodscent Ln
- 1654 Woodscent Ln
- 1668 Moonseed Ln Unit 235
- 1654 Moonseed Ln
- 1691 Moonseed Ln
- 1678 Moonseed Ln
- 1690 Woodscent Ln
- 1690 Moonseed Ln
- 1655 Spinwood Ln Unit 237
- 1667 Spinwood Ln Unit 238
- 1679 Spinwood Ln Unit 239
- 1679 Woodscent Ln
- 1655 Woodscent Ln
- 1667 Woodscent Ln
- 1691 Spinwood Ln
- 457 Vorale Ave
- 1691 Woodscent Ln