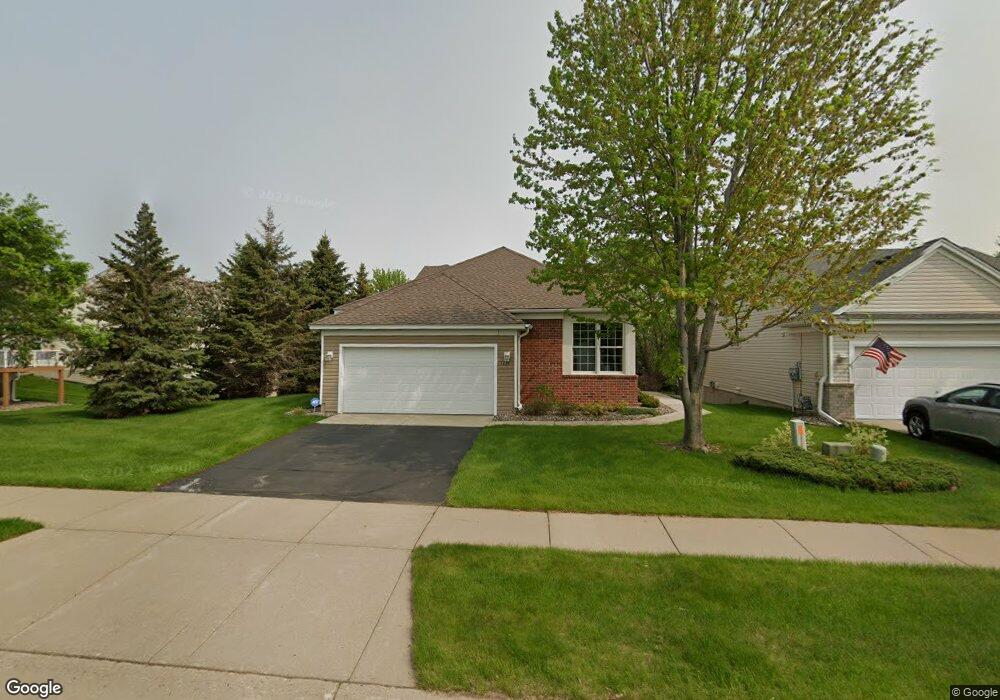
1671 Oakbrooke Way Saint Paul, MN 55122
Estimated Value: $414,000 - $472,000
3
Beds
3
Baths
2,948
Sq Ft
$150/Sq Ft
Est. Value
About This Home
This home is located at 1671 Oakbrooke Way, Saint Paul, MN 55122 and is currently estimated at $441,990, approximately $149 per square foot. 1671 Oakbrooke Way is a home located in Dakota County with nearby schools including Deerwood Elementary School, Black Hawk Middle School, and Eagan Senior High School.
Ownership History
Date
Name
Owned For
Owner Type
Purchase Details
Closed on
May 3, 2019
Sold by
Larrea Julian
Bought by
Carpenter Lowell Scott and Carpenter Judy Mae
Current Estimated Value
Home Financials for this Owner
Home Financials are based on the most recent Mortgage that was taken out on this home.
Original Mortgage
$237,500
Outstanding Balance
$207,958
Interest Rate
4%
Mortgage Type
New Conventional
Estimated Equity
$234,032
Purchase Details
Closed on
Jan 27, 2010
Sold by
Federal National Mortgage Association
Bought by
Larrea Julian
Home Financials for this Owner
Home Financials are based on the most recent Mortgage that was taken out on this home.
Original Mortgage
$185,440
Interest Rate
5.2%
Mortgage Type
New Conventional
Purchase Details
Closed on
Dec 4, 2000
Sold by
Pulte Homes Of Mn
Bought by
Mcloyd Leonard E and Mcloyd Kimberly A
Create a Home Valuation Report for This Property
The Home Valuation Report is an in-depth analysis detailing your home's value as well as a comparison with similar homes in the area
Home Values in the Area
Average Home Value in this Area
Purchase History
| Date | Buyer | Sale Price | Title Company |
|---|---|---|---|
| Carpenter Lowell Scott | $375,000 | Edina Realty Title Inc | |
| Larrea Julian | $231,800 | -- | |
| Mcloyd Leonard E | $236,465 | -- |
Source: Public Records
Mortgage History
| Date | Status | Borrower | Loan Amount |
|---|---|---|---|
| Open | Carpenter Lowell Scott | $237,500 | |
| Previous Owner | Larrea Julian | $185,440 |
Source: Public Records
Tax History Compared to Growth
Tax History
| Year | Tax Paid | Tax Assessment Tax Assessment Total Assessment is a certain percentage of the fair market value that is determined by local assessors to be the total taxable value of land and additions on the property. | Land | Improvement |
|---|---|---|---|---|
| 2024 | $4,512 | $435,600 | $68,700 | $366,900 |
| 2023 | $4,512 | $415,500 | $68,300 | $347,200 |
| 2022 | $4,274 | $402,000 | $68,100 | $333,900 |
| 2021 | $4,084 | $382,200 | $59,200 | $323,000 |
| 2020 | $4,198 | $358,000 | $56,400 | $301,600 |
| 2019 | $3,756 | $358,100 | $53,700 | $304,400 |
| 2018 | $3,441 | $339,100 | $49,700 | $289,400 |
| 2017 | $3,364 | $303,500 | $45,200 | $258,300 |
| 2016 | $3,219 | $275,700 | $43,000 | $232,700 |
| 2015 | $2,859 | $261,500 | $41,400 | $220,100 |
| 2014 | -- | $236,200 | $38,800 | $197,400 |
| 2013 | -- | $217,400 | $34,800 | $182,600 |
Source: Public Records
Map
Nearby Homes
- 1680 Oakbrooke Ct
- 4100 Meadowlark Ln
- 1612 Summit Hill
- 3958 Riverton Ave
- 4168 Arbor Ln
- 1781 Taconite Point
- 4249 Boulder Ridge Point
- 1630 Murphy Pkwy
- 4055 Cinnabar Dr
- 3933 Donegal Way
- 1867 N Ruby Ct
- 4290 Blackhawk Rd
- 1610 Clemson Dr
- 1902 Sapphire Point Unit 110
- 4163 Starbridge Ct
- 1914 Sapphire Point Unit 102
- 1536 Stonewood Ln
- 1865 Deer Hills Trail
- 1924 Sapphire Point Unit 97
- 1880 Deer Hills Trail
- 1669 Oakbrooke Way
- 1685 Oakbrooke Way
- 1667 Oakbrooke Way
- 1683 Oakbrooke Way
- 1687 1687 Oakbrooke-Way-
- 1687 Oakbrooke Way
- 1689 Oakbrooke Way
- 1665 Oakbrooke Way
- 1691 Oakbrooke Way
- 1670 Oakbrooke Way
- 1668 Oakbrooke Way
- 4135 Oakbrooke Trail
- 1672 Oakbrooke Way
- 1666 Oakbrooke Way
- 1663 Oakbrooke Way
- 4133 Oakbrooke Trail
- 1674 Oakbrooke Way
- 1664 Oakbrooke Way
- 1701 Oakbrooke Way
- 1707 Oakbrooke Way