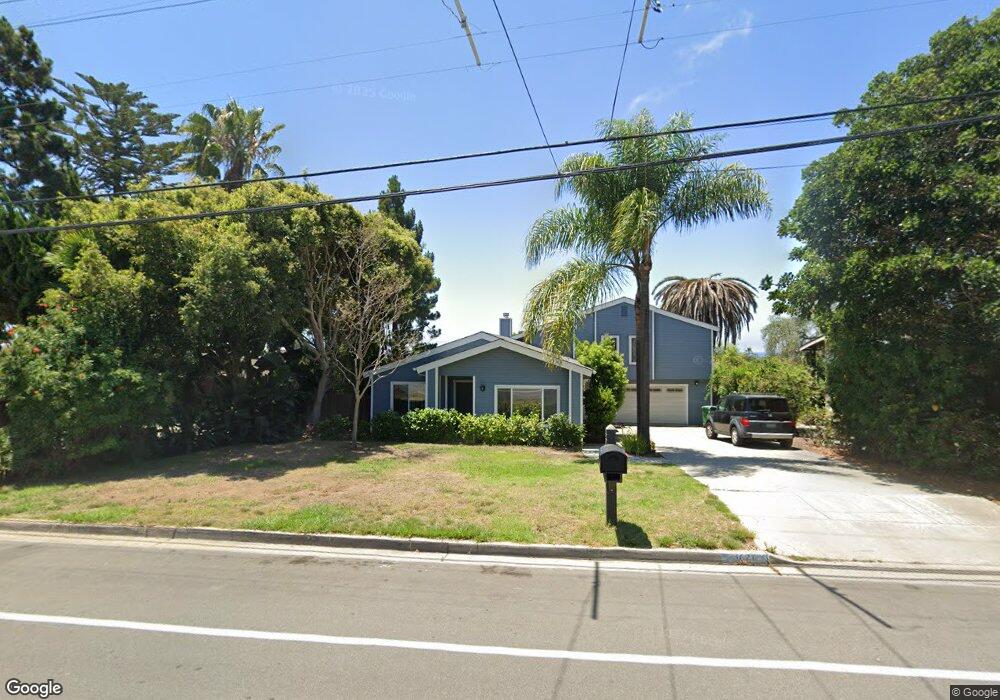
1671 Ridgeway St Oceanside, CA 92054
Fire Mountain NeighborhoodEstimated Value: $1,347,000 - $1,597,000
2
Beds
2
Baths
2,361
Sq Ft
$614/Sq Ft
Est. Value
About This Home
This home is located at 1671 Ridgeway St, Oceanside, CA 92054 and is currently estimated at $1,449,010, approximately $613 per square foot. 1671 Ridgeway St is a home located in San Diego County with nearby schools including Palmquist Elementary School, Lincoln Middle School, and Oceanside High School.
Ownership History
Date
Name
Owned For
Owner Type
Purchase Details
Closed on
Nov 20, 2025
Sold by
Foster Duncan
Bought by
Maureen D Foster Trust and Foster
Current Estimated Value
Purchase Details
Closed on
Apr 19, 2020
Sold by
Foster Maureen D and Foster Duncan
Bought by
Foster Maureen D and Foster Duncan
Home Financials for this Owner
Home Financials are based on the most recent Mortgage that was taken out on this home.
Original Mortgage
$140,000
Interest Rate
3.3%
Mortgage Type
New Conventional
Purchase Details
Closed on
May 20, 2010
Sold by
Foster Maureen D
Bought by
Foster Maureen D and Foster Duncan
Purchase Details
Closed on
Aug 18, 1999
Sold by
Foster Alan R and Foster Maureen D
Bought by
Foster Alan R and Foster Maureen D
Purchase Details
Closed on
Nov 9, 1995
Sold by
Fuchs John L and Fuchs Sondra L
Bought by
Foster Alan R and Foster Maureen D
Home Financials for this Owner
Home Financials are based on the most recent Mortgage that was taken out on this home.
Original Mortgage
$50,000
Interest Rate
7.48%
Purchase Details
Closed on
Feb 19, 1992
Create a Home Valuation Report for This Property
The Home Valuation Report is an in-depth analysis detailing your home's value as well as a comparison with similar homes in the area
Home Values in the Area
Average Home Value in this Area
Purchase History
| Date | Buyer | Sale Price | Title Company |
|---|---|---|---|
| Maureen D Foster Trust | -- | None Listed On Document | |
| Foster Duncan | -- | None Listed On Document | |
| Foster Maureen D | -- | Solidifi | |
| Foster Maureen D | -- | None Available | |
| Foster Alan R | -- | -- | |
| Foster Alan R | $250,000 | Commonwealth Land Title Co | |
| -- | $265,000 | -- |
Source: Public Records
Mortgage History
| Date | Status | Borrower | Loan Amount |
|---|---|---|---|
| Previous Owner | Foster Maureen D | $140,000 | |
| Previous Owner | Foster Alan R | $50,000 |
Source: Public Records
Tax History
| Year | Tax Paid | Tax Assessment Tax Assessment Total Assessment is a certain percentage of the fair market value that is determined by local assessors to be the total taxable value of land and additions on the property. | Land | Improvement |
|---|---|---|---|---|
| 2025 | $4,884 | $440,907 | $166,113 | $274,794 |
| 2024 | $4,884 | $432,262 | $162,856 | $269,406 |
| 2023 | $4,734 | $423,787 | $159,663 | $264,124 |
| 2022 | $4,663 | $415,479 | $156,533 | $258,946 |
| 2021 | $4,681 | $407,333 | $153,464 | $253,869 |
| 2020 | $4,537 | $403,157 | $151,891 | $251,266 |
| 2019 | $4,406 | $395,253 | $148,913 | $246,340 |
| 2018 | $4,359 | $387,504 | $145,994 | $241,510 |
| 2017 | $4,279 | $379,907 | $143,132 | $236,775 |
| 2016 | $4,140 | $372,459 | $140,326 | $232,133 |
| 2015 | $4,020 | $366,866 | $138,219 | $228,647 |
| 2014 | $3,865 | $359,681 | $135,512 | $224,169 |
Source: Public Records
Map
Nearby Homes
- 1765 Ivy Rd
- 1520 Downs St
- 1782 Troy Ln
- 1773 Ivy Rd
- 1850 Downs St
- 2241 California St
- 1535 Molly Cir
- 1720 California St
- 1607 Hunsaker St
- 1519 Kurtz St
- 1858 Avocado Rd
- 1738 Kurtz St
- 2070 Rue de la Montagne
- 2309 Loker Way
- 2277 Dunstan St
- 2306 Loker Way
- 2308 Loker Way
- 2312 Loker Way
- 1513 California St
- 1504 Valencia St
- 1679 Ridgeway St
- 1649 Ridgeway St
- 1836 Fire Mountain Dr
- 1685 Ridgeway St
- 1625 Ridgeway St
- 1632 Ridgeway St
- 1628 Ridgeway St
- 1630 Ridgeway St
- 1617 Ridgeway St
- 1626 Ridgeway St
- 1818 Fuchsia Ct
- 1889 Fire Mountain Dr
- 2020 Fire Mountain Dr
- 1624 Ridgeway St
- 1822 Fuchsia Ct
- 1597 Ridgeway St
- 1814 Fuchsia Ct
- 1893 Fire Mountain Dr
- 1945 Fire Mountain Dr
- 1622 Ridgeway St
Your Personal Tour Guide
Ask me questions while you tour the home.