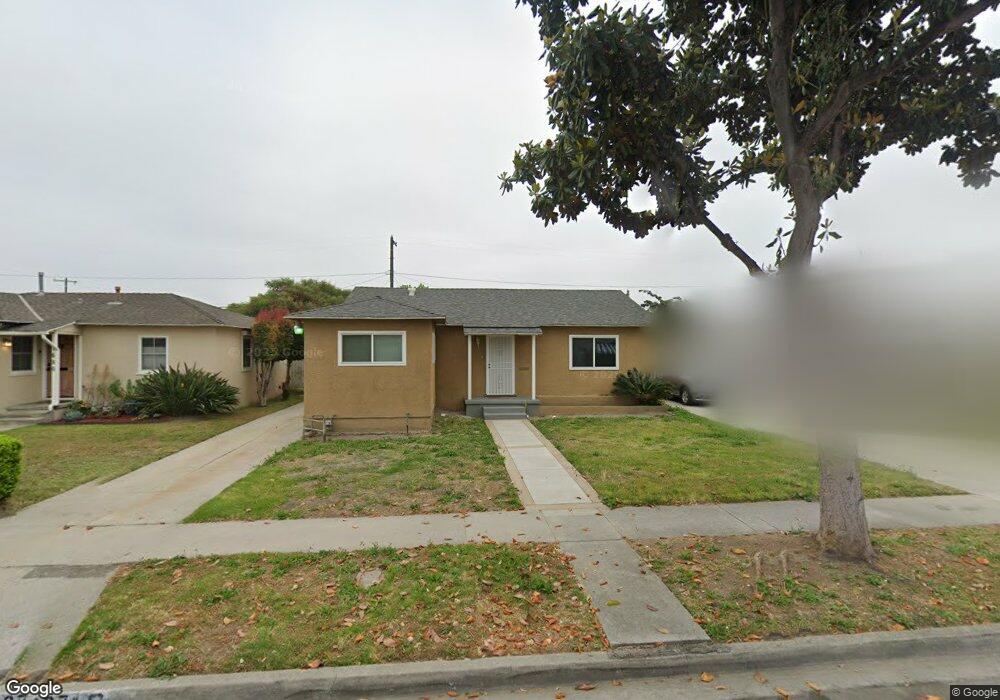
1674 E 122nd St Los Angeles, CA 90059
Estimated Value: $536,000 - $637,000
3
Beds
1
Bath
1,089
Sq Ft
$542/Sq Ft
Est. Value
About This Home
This home is located at 1674 E 122nd St, Los Angeles, CA 90059 and is currently estimated at $589,759, approximately $541 per square foot. 1674 E 122nd St is a home located in Los Angeles County with nearby schools including Carver Elementary School, Compton Early College, and Bunche Middle School.
Ownership History
Date
Name
Owned For
Owner Type
Purchase Details
Closed on
Jun 15, 2006
Sold by
Smith Clarence
Bought by
Brown Danielle R
Current Estimated Value
Purchase Details
Closed on
Mar 28, 2001
Sold by
Moses Andre A
Bought by
Moses Givell M
Home Financials for this Owner
Home Financials are based on the most recent Mortgage that was taken out on this home.
Original Mortgage
$100,000
Interest Rate
7.06%
Mortgage Type
Credit Line Revolving
Purchase Details
Closed on
Mar 9, 2001
Sold by
Brown Mary J
Bought by
Brown Mary J
Home Financials for this Owner
Home Financials are based on the most recent Mortgage that was taken out on this home.
Original Mortgage
$100,000
Interest Rate
7.06%
Mortgage Type
Credit Line Revolving
Purchase Details
Closed on
Nov 3, 1995
Sold by
Moses Givell M
Bought by
Brown Mary J
Create a Home Valuation Report for This Property
The Home Valuation Report is an in-depth analysis detailing your home's value as well as a comparison with similar homes in the area
Home Values in the Area
Average Home Value in this Area
Purchase History
| Date | Buyer | Sale Price | Title Company |
|---|---|---|---|
| Brown Danielle R | -- | None Available | |
| Moses Givell M | -- | Old Republic Title | |
| Brown Mary J | -- | Old Republic Title Company | |
| Brown Mary J | -- | -- |
Source: Public Records
Mortgage History
| Date | Status | Borrower | Loan Amount |
|---|---|---|---|
| Previous Owner | Brown Mary J | $100,000 |
Source: Public Records
Tax History Compared to Growth
Tax History
| Year | Tax Paid | Tax Assessment Tax Assessment Total Assessment is a certain percentage of the fair market value that is determined by local assessors to be the total taxable value of land and additions on the property. | Land | Improvement |
|---|---|---|---|---|
| 2025 | $4,819 | $349,609 | $253,764 | $95,845 |
| 2024 | $4,819 | $342,755 | $248,789 | $93,966 |
| 2023 | $4,759 | $336,035 | $243,911 | $92,124 |
| 2022 | $4,436 | $329,447 | $239,129 | $90,318 |
| 2021 | $4,519 | $322,989 | $234,441 | $88,548 |
| 2019 | $4,391 | $313,412 | $227,489 | $85,923 |
| 2018 | $4,237 | $307,268 | $223,029 | $84,239 |
| 2016 | $4,017 | $295,338 | $214,369 | $80,969 |
| 2015 | $3,805 | $290,902 | $211,149 | $79,753 |
| 2014 | $3,736 | $285,204 | $207,013 | $78,191 |
Source: Public Records
Map
Nearby Homes
- 1662 E 124th St
- 1727 E 123rd St
- 1726 E 122nd St
- 12233 Compton Ave
- 1950 N Bloom Dr
- 1842 E 123rd St
- 1563 E 119th St
- 11847 Alabama St
- 12400 S Wilmington Ave
- 1571 E 118th St
- 12623 S Slater Ave
- 917 W 130th St
- 1239 E 124th St
- 1210 W 130th St
- 2028 E 126th St
- 12119 Alvaro St
- 11912 Elva Ave
- 1220 E 121st St
- 1925 E 130th St
- 12106 S Willowbrook Ave
- 1680 E 122nd St
- 1670 E 122nd St
- 1684 E 122nd St
- 1664 E 122nd St
- 1675 E 123rd St
- 1671 E 123rd St Unit 2
- 1671 E 123rd St
- 1681 E 123rd St
- 1660 E 122nd St
- 1690 E 122nd St
- 1685 E 123rd St
- 1665 E 123rd St
- 1675 E 122nd St
- 1671 E 122nd St
- 1681 E 122nd St
- 1661 E 123rd St
- 1691 E 123rd St
- 1654 E 122nd St
- 1685 E 122nd St
- 1665 E 122nd St