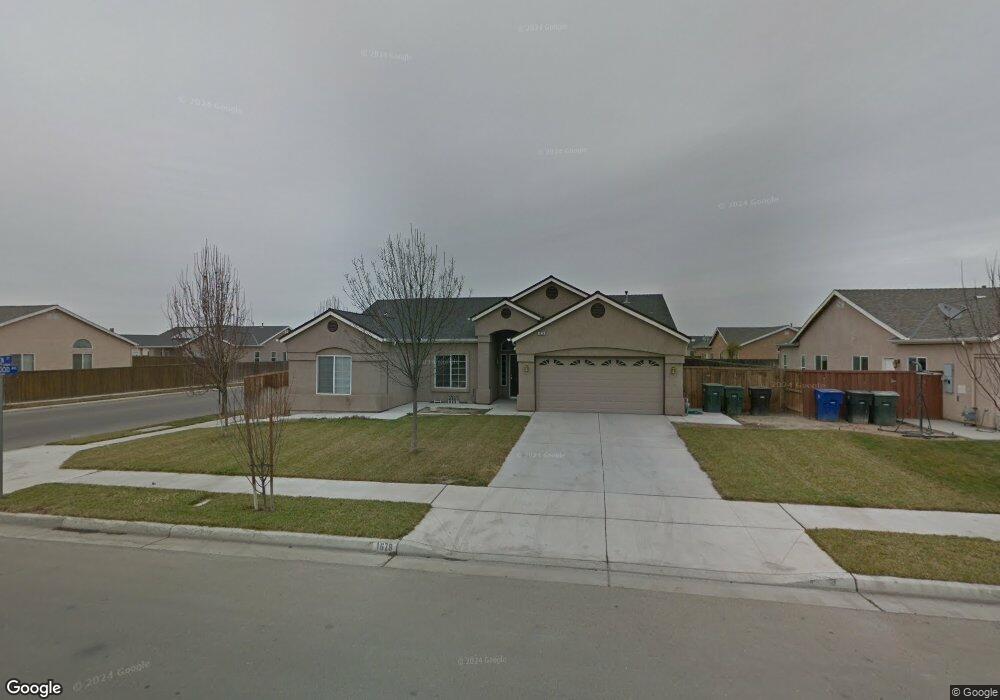
1678 Linden St Lemoore, CA 93245
Estimated Value: $366,036 - $424,000
4
Beds
2
Baths
1,754
Sq Ft
$228/Sq Ft
Est. Value
About This Home
This home is located at 1678 Linden St, Lemoore, CA 93245 and is currently estimated at $400,759, approximately $228 per square foot. 1678 Linden St is a home located in Kings County with nearby schools including Meadow Lane Elementary School, Liberty Middle School, and Lemoore High School.
Ownership History
Date
Name
Owned For
Owner Type
Purchase Details
Closed on
May 5, 2010
Sold by
Ho Michael B
Bought by
Munoz Veronica
Current Estimated Value
Home Financials for this Owner
Home Financials are based on the most recent Mortgage that was taken out on this home.
Original Mortgage
$183,600
Outstanding Balance
$123,060
Interest Rate
5.05%
Mortgage Type
New Conventional
Estimated Equity
$277,699
Purchase Details
Closed on
Jul 27, 2006
Sold by
Hernandez Martina
Bought by
Ho Michael B
Home Financials for this Owner
Home Financials are based on the most recent Mortgage that was taken out on this home.
Original Mortgage
$211,080
Interest Rate
8.75%
Mortgage Type
Negative Amortization
Purchase Details
Closed on
Jul 5, 2006
Sold by
Lennar Fresno Inc
Bought by
Ho Michael B
Home Financials for this Owner
Home Financials are based on the most recent Mortgage that was taken out on this home.
Original Mortgage
$211,080
Interest Rate
8.75%
Mortgage Type
Negative Amortization
Create a Home Valuation Report for This Property
The Home Valuation Report is an in-depth analysis detailing your home's value as well as a comparison with similar homes in the area
Home Values in the Area
Average Home Value in this Area
Purchase History
We collect this data history from publicly available records. To have your information removed, we recommend requesting removal directly through your county’s website.
| Date | Buyer | Sale Price | Title Company |
|---|---|---|---|
| Munoz Veronica | $180,000 | First American Title Company | |
| Ho Michael B | -- | North American Title Co | |
| Ho Michael B | $264,000 | North American Title Co |
Source: Public Records
Mortgage History
We collect this data history from publicly available records. To have your information removed, we recommend requesting removal directly through your county’s website.
| Date | Status | Borrower | Loan Amount |
|---|---|---|---|
| Open | Munoz Veronica | $183,600 | |
| Previous Owner | Ho Michael B | $211,080 | |
| Previous Owner | Ho Michael B | $52,770 |
Source: Public Records
Tax History
| Year | Tax Paid | Tax Assessment Tax Assessment Total Assessment is a certain percentage of the fair market value that is determined by local assessors to be the total taxable value of land and additions on the property. | Land | Improvement |
|---|---|---|---|---|
| 2025 | $2,437 | $232,344 | $83,903 | $148,441 |
| 2023 | $2,437 | $223,324 | $80,646 | $142,678 |
| 2022 | $2,553 | $218,946 | $79,065 | $139,881 |
| 2021 | $2,448 | $214,654 | $77,515 | $137,139 |
| 2020 | $2,435 | $212,453 | $76,720 | $135,733 |
| 2019 | $2,416 | $208,288 | $75,216 | $133,072 |
| 2018 | $2,313 | $204,204 | $73,741 | $130,463 |
| 2017 | $2,316 | $200,200 | $72,295 | $127,905 |
| 2016 | $2,253 | $196,274 | $70,877 | $125,397 |
| 2015 | $2,244 | $193,325 | $69,812 | $123,513 |
| 2014 | $2,183 | $189,538 | $68,444 | $121,094 |
Source: Public Records
Map
Nearby Homes
- 1757 Homestead Way
- 1435 Summerwind Dr
- 1644 Butternut St
- 1384 Tulip St
- 1462 Chimney Way
- 1497 Persimmon St
- 1410 Mulberry Ln
- 1410 W Bush St
- 175 S 19th Ave
- 844 Arlington Ave
- 50 N 19th Ave Unit A-F
- 50 N 19th Ave
- 865 Avalon Dr
- 320 Byron Ct
- 25 Linda Ln
- 18 N Byron Dr
- 1155 Narwhal Ave
- 1405 Lincoln Ln
- 155 Lum Dr
- 335 Kenwood Dr
Your Personal Tour Guide
Ask me questions while you tour the home.