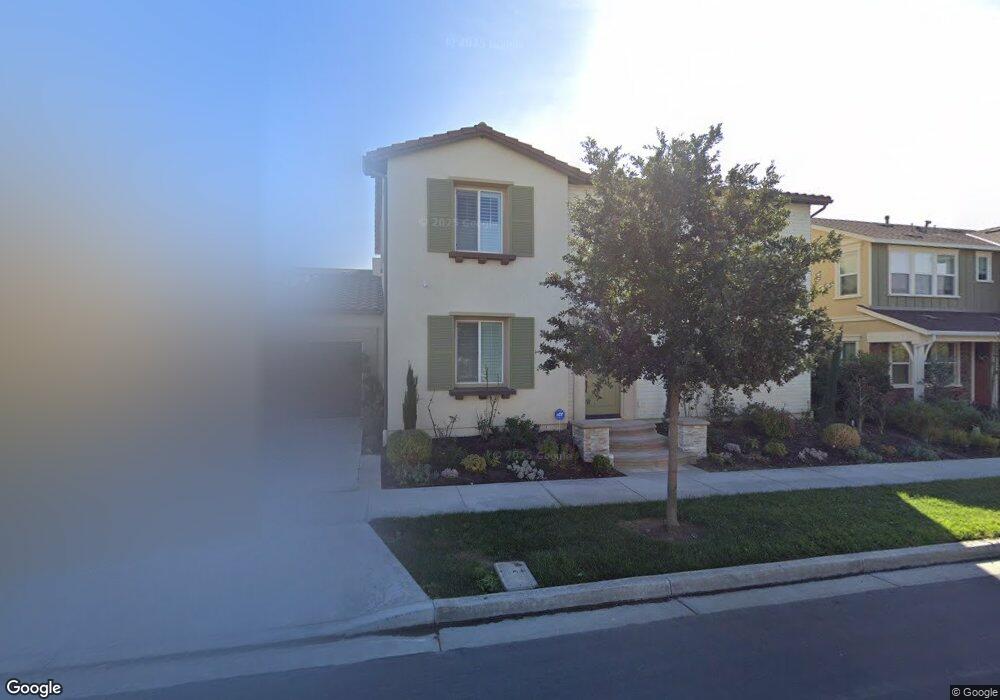
168 Salmon Irvine, CA 92618
Great Park NeighborhoodEstimated Value: $2,096,914 - $2,310,000
5
Beds
3
Baths
2,536
Sq Ft
$878/Sq Ft
Est. Value
About This Home
This home is located at 168 Salmon, Irvine, CA 92618 and is currently estimated at $2,225,479, approximately $877 per square foot. 168 Salmon is a home with nearby schools including Beacon Park, Portola High School, and Woodbury Elementary School.
Ownership History
Date
Name
Owned For
Owner Type
Purchase Details
Closed on
Mar 29, 2014
Sold by
Lyon Whistler Llc
Bought by
Krishnan Murugan and Murugan Krupa
Current Estimated Value
Home Financials for this Owner
Home Financials are based on the most recent Mortgage that was taken out on this home.
Original Mortgage
$728,800
Outstanding Balance
$530,412
Interest Rate
3.25%
Mortgage Type
Adjustable Rate Mortgage/ARM
Estimated Equity
$1,695,067
Create a Home Valuation Report for This Property
The Home Valuation Report is an in-depth analysis detailing your home's value as well as a comparison with similar homes in the area
Home Values in the Area
Average Home Value in this Area
Purchase History
| Date | Buyer | Sale Price | Title Company |
|---|---|---|---|
| Krishnan Murugan | $911,500 | First American Title Company |
Source: Public Records
Mortgage History
| Date | Status | Borrower | Loan Amount |
|---|---|---|---|
| Open | Krishnan Murugan | $728,800 |
Source: Public Records
Tax History
| Year | Tax Paid | Tax Assessment Tax Assessment Total Assessment is a certain percentage of the fair market value that is determined by local assessors to be the total taxable value of land and additions on the property. | Land | Improvement |
|---|---|---|---|---|
| 2025 | $18,692 | $1,117,219 | $635,025 | $482,194 |
| 2024 | $18,692 | $1,095,313 | $622,573 | $472,740 |
| 2023 | $18,287 | $1,073,837 | $610,366 | $463,471 |
| 2022 | $17,927 | $1,052,782 | $598,398 | $454,384 |
| 2021 | $17,574 | $1,032,140 | $586,665 | $445,475 |
| 2020 | $17,425 | $1,021,557 | $580,649 | $440,908 |
| 2019 | $17,144 | $1,001,527 | $569,264 | $432,263 |
| 2018 | $16,806 | $981,890 | $558,102 | $423,788 |
| 2017 | $16,475 | $962,638 | $547,159 | $415,479 |
| 2016 | $16,151 | $943,763 | $536,430 | $407,333 |
| 2015 | $15,878 | $929,587 | $528,372 | $401,215 |
| 2014 | $14,537 | $807,914 | $437,787 | $370,127 |
Source: Public Records
Map
Nearby Homes
Your Personal Tour Guide
Ask me questions while you tour the home.