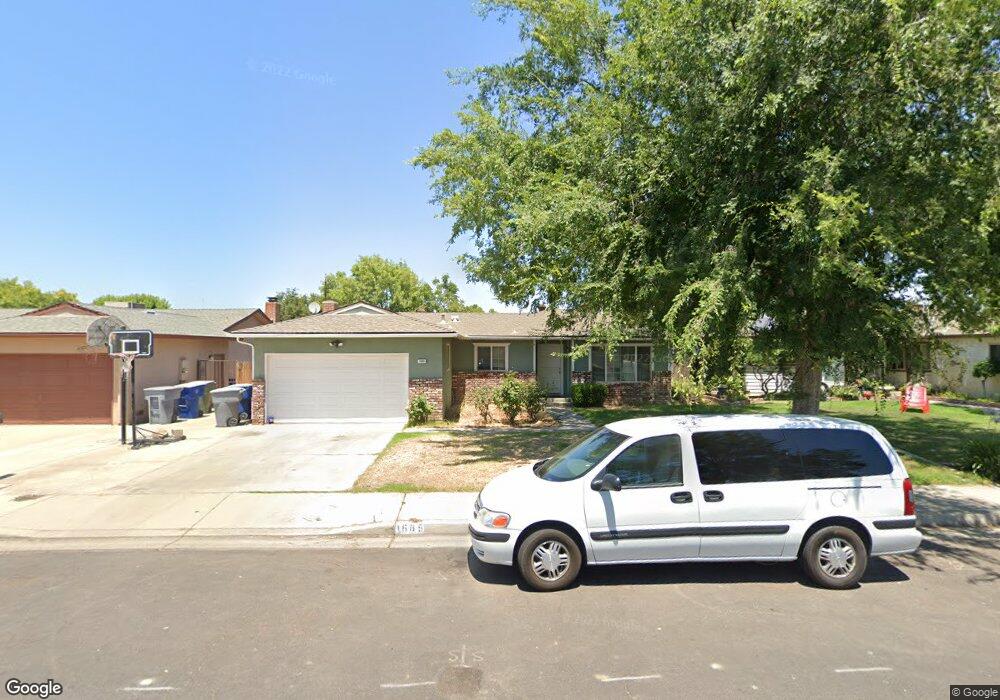
1685 Dennis Ave Clovis, CA 93611
Estimated Value: $375,661 - $406,000
3
Beds
2
Baths
1,407
Sq Ft
$276/Sq Ft
Est. Value
About This Home
This home is located at 1685 Dennis Ave, Clovis, CA 93611 and is currently estimated at $388,554, approximately $276 per square foot. 1685 Dennis Ave is a home located in Fresno County with nearby schools including Jefferson Elementary School, Clark Intermediate School, and Clovis High School.
Ownership History
Date
Name
Owned For
Owner Type
Purchase Details
Closed on
Mar 21, 2019
Sold by
Garnica Giovanni
Bought by
Garnica William
Current Estimated Value
Purchase Details
Closed on
Jul 18, 2011
Sold by
Torres Simon
Bought by
Garnica Giovanni
Purchase Details
Closed on
Nov 9, 1999
Sold by
Riley Kenneth F and Riley Patricia D
Bought by
Torres Simon
Home Financials for this Owner
Home Financials are based on the most recent Mortgage that was taken out on this home.
Original Mortgage
$80,000
Interest Rate
3.85%
Purchase Details
Closed on
Dec 9, 1993
Sold by
Riley Patricia D and Nadeau Patricia D
Bought by
Riley Patricia D and Riley Kenneth F
Home Financials for this Owner
Home Financials are based on the most recent Mortgage that was taken out on this home.
Original Mortgage
$23,000
Interest Rate
7.09%
Create a Home Valuation Report for This Property
The Home Valuation Report is an in-depth analysis detailing your home's value as well as a comparison with similar homes in the area
Home Values in the Area
Average Home Value in this Area
Purchase History
| Date | Buyer | Sale Price | Title Company |
|---|---|---|---|
| Garnica William | -- | None Available | |
| Garnica Giovanni | $108,000 | First American Title Company | |
| Torres Simon | $100,000 | Stewart Title | |
| Riley Patricia D | -- | Chicago Title |
Source: Public Records
Mortgage History
| Date | Status | Borrower | Loan Amount |
|---|---|---|---|
| Previous Owner | Torres Simon | $80,000 | |
| Previous Owner | Riley Patricia D | $23,000 |
Source: Public Records
Tax History
| Year | Tax Paid | Tax Assessment Tax Assessment Total Assessment is a certain percentage of the fair market value that is determined by local assessors to be the total taxable value of land and additions on the property. | Land | Improvement |
|---|---|---|---|---|
| 2025 | $1,607 | $135,013 | $50,235 | $84,778 |
| 2023 | $1,577 | $129,772 | $48,285 | $81,487 |
| 2022 | $1,527 | $127,229 | $47,339 | $79,890 |
| 2021 | $1,484 | $124,735 | $46,411 | $78,324 |
| 2020 | $1,479 | $123,457 | $45,936 | $77,521 |
| 2019 | $1,450 | $121,037 | $45,036 | $76,001 |
| 2018 | $1,419 | $118,664 | $44,153 | $74,511 |
| 2017 | $1,395 | $116,338 | $43,288 | $73,050 |
| 2016 | $1,348 | $114,058 | $42,440 | $71,618 |
| 2015 | $1,328 | $112,346 | $41,803 | $70,543 |
| 2014 | $1,303 | $110,147 | $40,985 | $69,162 |
Source: Public Records
Map
Nearby Homes
- 1273 Bundy Ave
- 1622 Dennis Ave
- 1606 Barstow Ave
- 1721 Beverly Ave
- 1334 Shirley Ave
- 1428 Miami Ave
- 1515 Keats Ave
- 1876 Cougar Ln
- 1584 Laverne Ave
- 1895 Dennis Ave
- 860 Mcarthur Ave
- 1228 Jefferson Ave
- 3497 Shaw Ave
- 760 Sunnyside Ave
- 2214 Fordham Ave
- 2306 Stanford Ave
- 2034 Wrenwood Ave
- 1488 Alamos Ave
- 1272 Bullard Ave
- 1946 Calimyrna Ave
- 1675 Dennis Ave
- 1695 Dennis Ave
- 1684 Mitchell Ave
- 1674 Mitchell Ave
- 1665 Dennis Ave
- 1705 Dennis Ave
- 1664 Mitchell Ave
- 1682 Dennis Ave
- 1694 Mitchell Ave
- 1672 Dennis Ave
- 1655 Dennis Ave
- 1715 Dennis Ave
- 1654 Mitchell Ave
- 1702 Dennis Ave
- 1662 Dennis Ave
- 1712 Dennis Ave
- 1645 Dennis Ave
- 1679 Mitchell Ave
- 1681 Beverly Ave
Your Personal Tour Guide
Ask me questions while you tour the home.