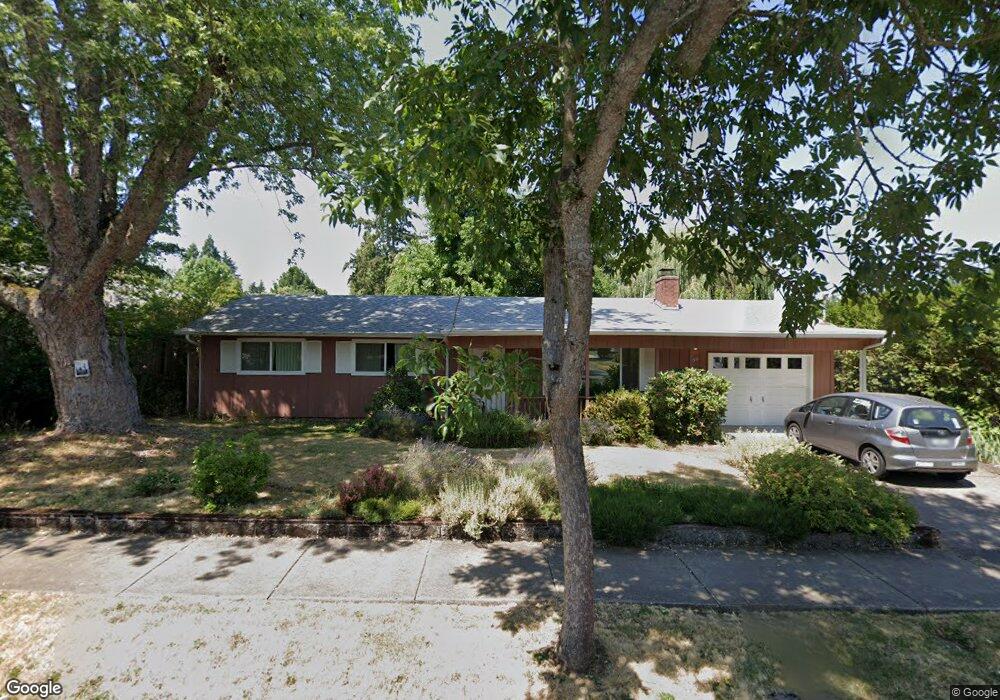
169 E 40th Ave Eugene, OR 97405
Southeast Eugene NeighborhoodEstimated Value: $479,000 - $515,000
3
Beds
2
Baths
1,260
Sq Ft
$388/Sq Ft
Est. Value
About This Home
This home is located at 169 E 40th Ave, Eugene, OR 97405 and is currently estimated at $488,721, approximately $387 per square foot. 169 E 40th Ave is a home located in Lane County with nearby schools including Edgewood Community Elementary School, Spencer Butte Middle School, and South Eugene High School.
Ownership History
Date
Name
Owned For
Owner Type
Purchase Details
Closed on
Jun 2, 2010
Sold by
Everett Herbert and Bray Nancy
Bought by
Everett Herbert Lyman and Bray Nancy Joan
Current Estimated Value
Purchase Details
Closed on
Apr 20, 2009
Sold by
White David W
Bought by
Everett Jesse and Everett Herbert
Home Financials for this Owner
Home Financials are based on the most recent Mortgage that was taken out on this home.
Original Mortgage
$160,000
Outstanding Balance
$101,143
Interest Rate
5.02%
Mortgage Type
Purchase Money Mortgage
Estimated Equity
$387,578
Purchase Details
Closed on
Apr 17, 2009
Sold by
Everett Herbert and Bray Nancy
Bought by
Everett Herbert and Bray Nancy
Home Financials for this Owner
Home Financials are based on the most recent Mortgage that was taken out on this home.
Original Mortgage
$160,000
Outstanding Balance
$101,143
Interest Rate
5.02%
Mortgage Type
Purchase Money Mortgage
Estimated Equity
$387,578
Create a Home Valuation Report for This Property
The Home Valuation Report is an in-depth analysis detailing your home's value as well as a comparison with similar homes in the area
Home Values in the Area
Average Home Value in this Area
Purchase History
| Date | Buyer | Sale Price | Title Company |
|---|---|---|---|
| Everett Herbert Lyman | -- | None Available | |
| Everett Jesse | $243,000 | First American Title | |
| Everett Herbert | -- | First American Title |
Source: Public Records
Mortgage History
| Date | Status | Borrower | Loan Amount |
|---|---|---|---|
| Open | Everett Jesse | $160,000 |
Source: Public Records
Tax History
| Year | Tax Paid | Tax Assessment Tax Assessment Total Assessment is a certain percentage of the fair market value that is determined by local assessors to be the total taxable value of land and additions on the property. | Land | Improvement |
|---|---|---|---|---|
| 2025 | $5,077 | $260,580 | -- | -- |
| 2024 | $5,014 | $252,991 | -- | -- |
| 2023 | $5,014 | $245,623 | $0 | $0 |
| 2022 | $4,697 | $238,469 | $0 | $0 |
| 2021 | $4,412 | $231,524 | $0 | $0 |
| 2020 | $4,427 | $224,781 | $0 | $0 |
| 2019 | $4,276 | $218,234 | $0 | $0 |
| 2018 | $4,025 | $205,707 | $0 | $0 |
| 2017 | $3,845 | $205,707 | $0 | $0 |
| 2016 | $3,749 | $199,716 | $0 | $0 |
| 2015 | $3,580 | $193,899 | $0 | $0 |
| 2014 | $3,568 | $188,251 | $0 | $0 |
Source: Public Records
Map
Nearby Homes
- 170 E 40th Ave
- 4023 Donald St Unit K
- 4083 Donald St Unit A
- 275 E 39th Ave
- 434 E 39th Ave
- 4295 Ferry St
- 0 E 39th Ave
- 17 Westbrook Way
- 21 Westbrook Way
- 75 W 35th Place
- 36 Westbrook Way
- 4425 Hilyard St
- 320 Dellwood Dr
- 4734 Brookwood St
- 555 Stafford Ct
- 4320 Fox Hollow Rd
- 585 E 36th Ave
- 4364 Fox Hollow Rd
- 910 E 43rd Ave
- 4845 Brookwood St
Your Personal Tour Guide
Ask me questions while you tour the home.