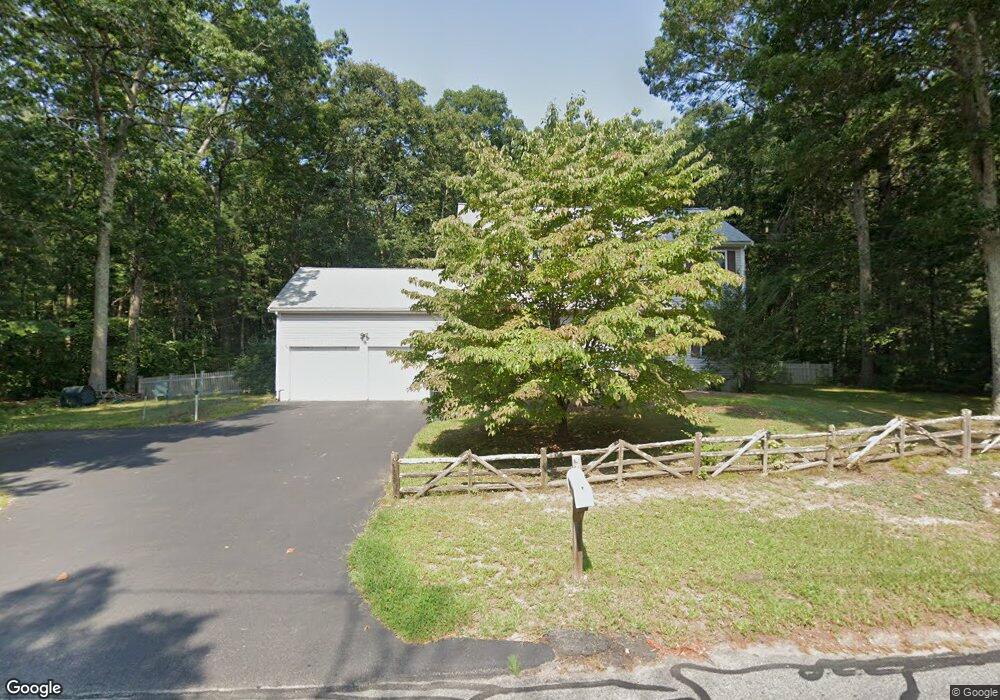
169 Pine St Franklin, MA 02038
Estimated Value: $709,674 - $878,000
4
Beds
3
Baths
1,818
Sq Ft
$429/Sq Ft
Est. Value
About This Home
This home is located at 169 Pine St, Franklin, MA 02038 and is currently estimated at $779,419, approximately $428 per square foot. 169 Pine St is a home located in Norfolk County with nearby schools including John F. Kennedy Memorial School, Horace Mann Middle School, and Franklin High School.
Ownership History
Date
Name
Owned For
Owner Type
Purchase Details
Closed on
Jan 28, 2016
Sold by
Butler 3Rd Kenneth J and Butler Judith V
Bought by
Butler Ret
Current Estimated Value
Purchase Details
Closed on
Dec 31, 1996
Sold by
C & G Devolopment Inc
Bought by
Butler Kenneth J and Butler Judith V
Home Financials for this Owner
Home Financials are based on the most recent Mortgage that was taken out on this home.
Original Mortgage
$167,600
Interest Rate
7.55%
Mortgage Type
Purchase Money Mortgage
Create a Home Valuation Report for This Property
The Home Valuation Report is an in-depth analysis detailing your home's value as well as a comparison with similar homes in the area
Purchase History
| Date | Buyer | Sale Price | Title Company |
|---|---|---|---|
| Butler Ret | -- | -- | |
| Butler Kenneth J | $209,500 | -- |
Source: Public Records
Mortgage History
| Date | Status | Borrower | Loan Amount |
|---|---|---|---|
| Previous Owner | Butler Kenneth J | $167,600 |
Source: Public Records
Tax History
| Year | Tax Paid | Tax Assessment Tax Assessment Total Assessment is a certain percentage of the fair market value that is determined by local assessors to be the total taxable value of land and additions on the property. | Land | Improvement |
|---|---|---|---|---|
| 2025 | $7,249 | $623,800 | $350,800 | $273,000 |
| 2024 | $7,062 | $599,000 | $350,800 | $248,200 |
| 2023 | $6,954 | $552,800 | $304,600 | $248,200 |
| 2022 | $6,337 | $451,000 | $230,800 | $220,200 |
| 2021 | $6,776 | $462,500 | $256,700 | $205,800 |
| 2020 | $6,325 | $435,900 | $239,700 | $196,200 |
| 2019 | $6,269 | $427,600 | $231,200 | $196,400 |
| 2018 | $5,924 | $404,400 | $227,100 | $177,300 |
| 2017 | $5,679 | $389,500 | $212,200 | $177,300 |
| 2016 | $5,696 | $392,800 | $214,500 | $178,300 |
| 2015 | $5,748 | $387,300 | $209,000 | $178,300 |
| 2014 | $5,215 | $360,900 | $183,300 | $177,600 |
Source: Public Records
Map
Nearby Homes
Your Personal Tour Guide
Ask me questions while you tour the home.