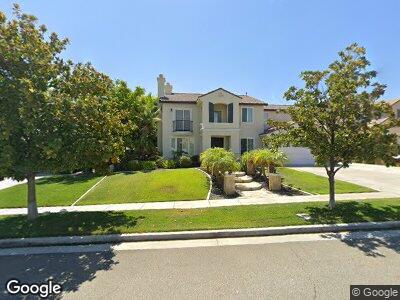
1690 Camino de Salmon St Corona, CA 92881
South Corona NeighborhoodEstimated Value: $1,097,000 - $1,199,000
3
Beds
3
Baths
2,600
Sq Ft
$444/Sq Ft
Est. Value
About This Home
This home is located at 1690 Camino de Salmon St, Corona, CA 92881 and is currently estimated at $1,153,770, approximately $443 per square foot. 1690 Camino de Salmon St is a home located in Riverside County with nearby schools including Orange Elementary School, Citrus Hills Intermediate School, and Santiago High School.
Ownership History
Date
Name
Owned For
Owner Type
Purchase Details
Closed on
Aug 23, 2019
Sold by
Odom Steven Mark and Odom Patricia Elizabeth
Bought by
Odom Steven Mark and Odom Patricia Elizabeth
Current Estimated Value
Purchase Details
Closed on
May 13, 2005
Sold by
Ball John K and Ball Cynthia M
Bought by
Odom Steven Mark and Odom Patricia Elizabeth
Home Financials for this Owner
Home Financials are based on the most recent Mortgage that was taken out on this home.
Original Mortgage
$599,900
Interest Rate
5%
Mortgage Type
Purchase Money Mortgage
Purchase Details
Closed on
Mar 31, 2003
Sold by
Pulte Home Corp
Bought by
Ball John K and Ball Cynthia M
Home Financials for this Owner
Home Financials are based on the most recent Mortgage that was taken out on this home.
Original Mortgage
$311,610
Interest Rate
5.87%
Mortgage Type
Purchase Money Mortgage
Create a Home Valuation Report for This Property
The Home Valuation Report is an in-depth analysis detailing your home's value as well as a comparison with similar homes in the area
Home Values in the Area
Average Home Value in this Area
Purchase History
| Date | Buyer | Sale Price | Title Company |
|---|---|---|---|
| Odom Steven Mark | -- | None Available | |
| Odom Steven Mark | $750,000 | Southland Title Company | |
| Ball John K | $424,000 | Chicago |
Source: Public Records
Mortgage History
| Date | Status | Borrower | Loan Amount |
|---|---|---|---|
| Open | Odom Steven Mark | $407,000 | |
| Closed | Odom Steven Mark | $423,400 | |
| Closed | Odom Steven Mark | $481,600 | |
| Closed | Odom Steven Mark | $599,900 | |
| Previous Owner | Ball John K | $317,500 | |
| Previous Owner | Ball John K | $81,441 | |
| Previous Owner | Ball John K | $311,610 |
Source: Public Records
Tax History Compared to Growth
Tax History
| Year | Tax Paid | Tax Assessment Tax Assessment Total Assessment is a certain percentage of the fair market value that is determined by local assessors to be the total taxable value of land and additions on the property. | Land | Improvement |
|---|---|---|---|---|
| 2023 | $13,419 | $939,033 | $375,302 | $563,731 |
| 2022 | $11,579 | $853,666 | $341,183 | $512,483 |
| 2021 | $10,131 | $723,445 | $289,138 | $434,307 |
| 2020 | $9,318 | $645,933 | $258,159 | $387,774 |
| 2019 | $9,082 | $627,120 | $250,640 | $376,480 |
| 2018 | $8,793 | $603,000 | $241,000 | $362,000 |
| 2017 | $8,671 | $595,000 | $238,000 | $357,000 |
| 2016 | $8,557 | $578,000 | $231,000 | $347,000 |
| 2015 | $8,336 | $553,000 | $221,000 | $332,000 |
| 2014 | $8,045 | $557,000 | $223,000 | $334,000 |
Source: Public Records
Map
Nearby Homes
- 3745 Nelson St
- 3887 Via Zumaya St
- 3535 Sunmeadow Cir
- 1633 Via Modena Way
- 1709 Duncan Way
- 0 Hayden Ave
- 3314 Via Padova Way
- 3321 Horizon St
- 3526 State St
- 3359 Willow Park Cir
- 20154 State St
- 1724 Honors Ln
- 20015 Winton St
- 1825 Duncan Way
- 1578 Twin Oaks Cir
- 1728 Tamarron Dr
- 11631009 Lester Ave
- 1696 Tamarron Dr
- 3361 Walkenridge Dr
- 2952 Villa Catalonia Ct
- 1690 Camino de Salmon St
- 1682 Camino de Salmon St
- 1698 Camino de Salmon St
- 1685 Albero Cir
- 1674 Camino de Salmon St
- 1693 Albero Cir
- 1687 Camino de Salmon St
- 1677 Albero Cir
- 1679 Camino de Salmon St
- 1695 Camino de Salmon St
- 1671 Camino de Salmon St
- 1703 Camino de Salmon St
- 1617 Camino Largo St
- 3635 Via Zumaya St
- 1629 Camino Largo St
- 1663 Camino de Salmon St
- 1711 Camino de Salmon St
- 1641 Camino Largo St
- 3671 Via Zumaya St
- 3712 Via Zumaya St