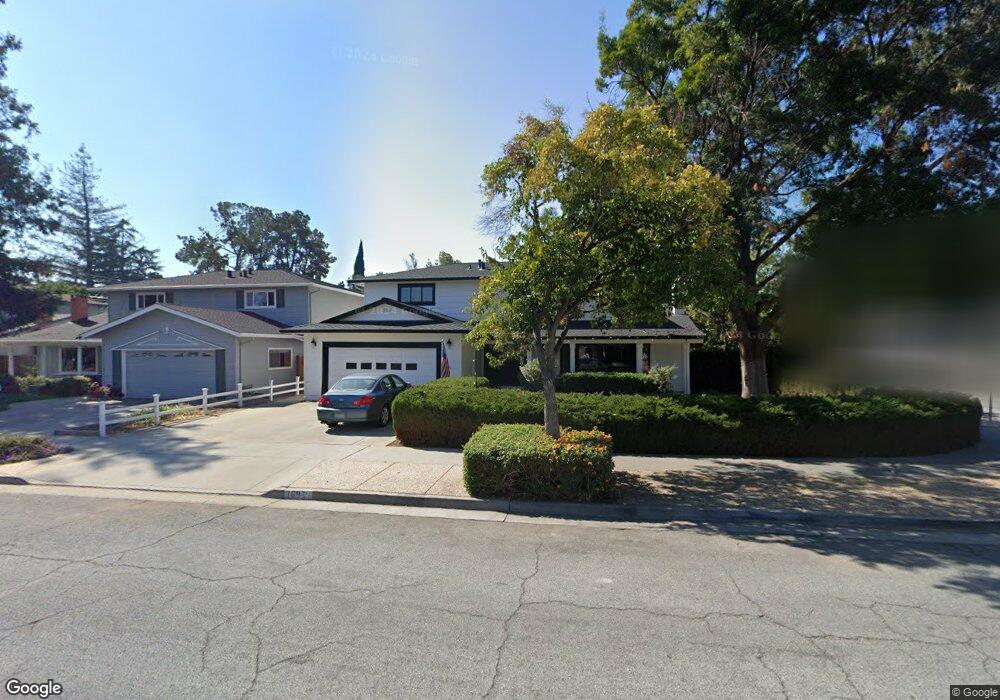
1692 Grizilo Dr San Jose, CA 95124
Doerr-Steindorf NeighborhoodEstimated Value: $2,119,000 - $2,272,000
5
Beds
3
Baths
2,191
Sq Ft
$1,001/Sq Ft
Est. Value
About This Home
This home is located at 1692 Grizilo Dr, San Jose, CA 95124 and is currently estimated at $2,193,033, approximately $1,000 per square foot. 1692 Grizilo Dr is a home located in Santa Clara County with nearby schools including Schallenberger Elementary School, Willow Glen Middle, and Willow Glen High School.
Ownership History
Date
Name
Owned For
Owner Type
Purchase Details
Closed on
Feb 23, 2007
Sold by
Wright Christine
Bought by
Wright Stephen M and Wright Catherine E
Current Estimated Value
Home Financials for this Owner
Home Financials are based on the most recent Mortgage that was taken out on this home.
Original Mortgage
$450,000
Outstanding Balance
$270,279
Interest Rate
6.21%
Mortgage Type
Negative Amortization
Estimated Equity
$1,922,754
Purchase Details
Closed on
Aug 3, 2005
Sold by
Wright Christine
Bought by
Wright Christine
Home Financials for this Owner
Home Financials are based on the most recent Mortgage that was taken out on this home.
Original Mortgage
$150,000
Interest Rate
5.56%
Mortgage Type
Credit Line Revolving
Purchase Details
Closed on
Jan 19, 2001
Sold by
Wright John H
Bought by
Wright John H and Wright Christine
Create a Home Valuation Report for This Property
The Home Valuation Report is an in-depth analysis detailing your home's value as well as a comparison with similar homes in the area
Home Values in the Area
Average Home Value in this Area
Purchase History
| Date | Buyer | Sale Price | Title Company |
|---|---|---|---|
| Wright Stephen M | $883,500 | Chicago Title Company | |
| Wright Christine | -- | Chicago Title Co | |
| Wright John H | -- | -- | |
| Wright John H | -- | -- |
Source: Public Records
Mortgage History
| Date | Status | Borrower | Loan Amount |
|---|---|---|---|
| Open | Wright Stephen M | $450,000 | |
| Previous Owner | Wright Christine | $150,000 |
Source: Public Records
Tax History
| Year | Tax Paid | Tax Assessment Tax Assessment Total Assessment is a certain percentage of the fair market value that is determined by local assessors to be the total taxable value of land and additions on the property. | Land | Improvement |
|---|---|---|---|---|
| 2025 | $3,641 | $117,883 | $31,850 | $86,033 |
| 2024 | $3,641 | $115,573 | $31,226 | $84,347 |
| 2023 | $3,517 | $113,308 | $30,614 | $82,694 |
| 2022 | $3,457 | $111,087 | $30,014 | $81,073 |
| 2021 | $3,295 | $108,910 | $29,426 | $79,484 |
| 2020 | $3,107 | $107,794 | $29,125 | $78,669 |
| 2019 | $2,985 | $105,681 | $28,554 | $77,127 |
| 2018 | $2,915 | $103,610 | $27,995 | $75,615 |
| 2017 | $2,868 | $101,580 | $27,447 | $74,133 |
| 2016 | $2,719 | $99,589 | $26,909 | $72,680 |
| 2015 | $4,826 | $98,094 | $26,505 | $71,589 |
| 2014 | $3,753 | $96,173 | $25,986 | $70,187 |
Source: Public Records
Map
Nearby Homes
- 1695 Grizilo Dr
- 1743 Willow Creek Ct
- 2881 Meridian Ave Unit 104
- 2881 Meridian Ave Unit 234
- 2881 Meridian Ave Unit 217
- 2812 Paseo Ln Unit 2812
- 2806 Paseo Ln
- 1658 N Pole Place Unit 1
- 2872 Manda Dr
- 1775 Wema Way
- 1653 Hillsdale Ave Unit 4
- 1792 Potrero Dr
- 1779 Foxworthy Ave
- 2823 Quinto Way
- 3210 Rama Dr
- 1795 Foxworthy Ave
- 2643 Hill Park Dr
- 3193 Calzar Dr
- 3609 Cefalu Dr
- 2788 Lexford Ave
- 1690 Grizilo Dr
- 1702 Grizilo Dr
- 1704 Grizilo Dr
- 1691 Grizilo Dr
- 1699 Grizilo Dr
- 1689 Grizilo Dr
- 1685 Don Ave
- 1693 Grizilo Dr
- 1684 Grizilo Dr
- 1687 Grizilo Dr
- 1697 Grizilo Dr
- 1706 Grizilo Dr
- 1687 Don Ave
- 2797 Lena Dr
- 1685 Grizilo Dr
- 2840 La Rhee Dr
- 2798 Lena Dr
- 1708 Grizilo Dr
- 2795 Lena Dr
- 1683 Grizilo Dr
Your Personal Tour Guide
Ask me questions while you tour the home.