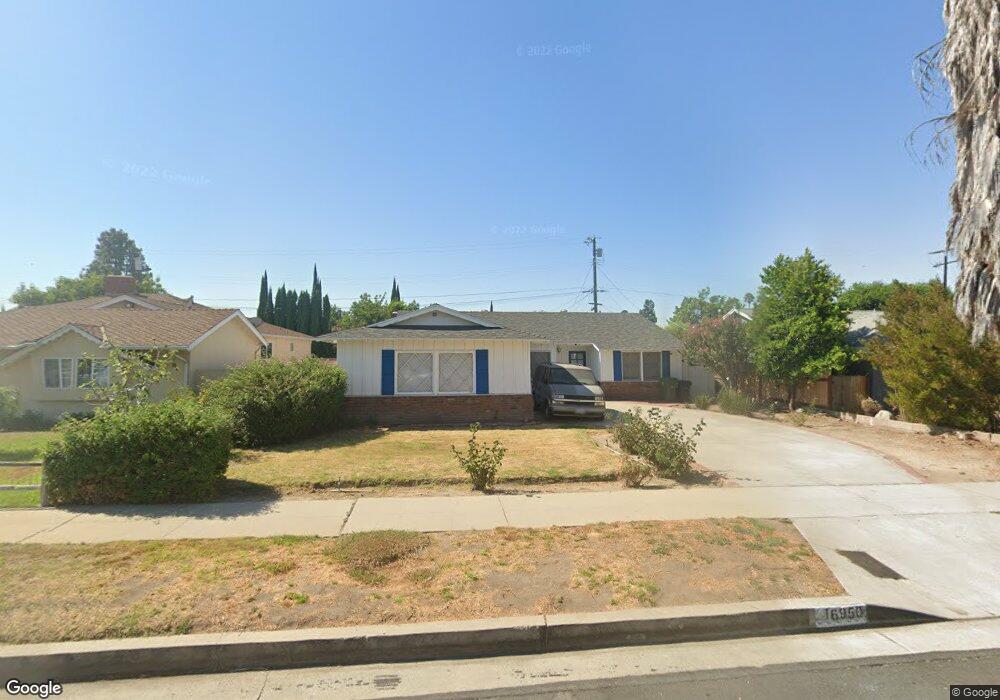
16950 Tupper St Northridge, CA 91343
Estimated Value: $960,720 - $1,074,000
3
Beds
2
Baths
1,769
Sq Ft
$576/Sq Ft
Est. Value
About This Home
This home is located at 16950 Tupper St, Northridge, CA 91343 and is currently estimated at $1,018,180, approximately $575 per square foot. 16950 Tupper St is a home located in Los Angeles County with nearby schools including Oliver Wendell Holmes Middle School, Northridge Academy High, and Valley Academy of Arts & Sciences.
Ownership History
Date
Name
Owned For
Owner Type
Purchase Details
Closed on
Jun 9, 1999
Sold by
Federal National Mortgage Association
Bought by
Pedraza Richard and Pedraza Lori
Current Estimated Value
Home Financials for this Owner
Home Financials are based on the most recent Mortgage that was taken out on this home.
Original Mortgage
$198,550
Outstanding Balance
$52,192
Interest Rate
7.01%
Estimated Equity
$965,988
Purchase Details
Closed on
Sep 18, 1998
Sold by
Tsapu Estella
Bought by
Federal National Mortgage Association
Purchase Details
Closed on
Jun 20, 1995
Sold by
Iacofano Timothy L and Iacofano Kathrine
Bought by
Tsapu Estella
Home Financials for this Owner
Home Financials are based on the most recent Mortgage that was taken out on this home.
Original Mortgage
$171,000
Interest Rate
7.74%
Create a Home Valuation Report for This Property
The Home Valuation Report is an in-depth analysis detailing your home's value as well as a comparison with similar homes in the area
Home Values in the Area
Average Home Value in this Area
Purchase History
| Date | Buyer | Sale Price | Title Company |
|---|---|---|---|
| Pedraza Richard | $209,000 | Chicago Title Co | |
| Federal National Mortgage Association | $150,234 | Landsafe Title | |
| Tsapu Estella | $190,000 | -- |
Source: Public Records
Mortgage History
| Date | Status | Borrower | Loan Amount |
|---|---|---|---|
| Open | Pedraza Richard | $198,550 | |
| Previous Owner | Tsapu Estella | $171,000 |
Source: Public Records
Tax History Compared to Growth
Tax History
| Year | Tax Paid | Tax Assessment Tax Assessment Total Assessment is a certain percentage of the fair market value that is determined by local assessors to be the total taxable value of land and additions on the property. | Land | Improvement |
|---|---|---|---|---|
| 2025 | $4,199 | $327,626 | $146,100 | $181,526 |
| 2024 | $4,199 | $321,203 | $143,236 | $177,967 |
| 2023 | $4,122 | $314,906 | $140,428 | $174,478 |
| 2022 | $3,938 | $308,732 | $137,675 | $171,057 |
| 2021 | $3,883 | $302,679 | $134,976 | $167,703 |
| 2019 | $3,771 | $293,703 | $130,973 | $162,730 |
| 2018 | $3,643 | $287,945 | $128,405 | $159,540 |
| 2016 | $3,467 | $276,766 | $123,420 | $153,346 |
| 2015 | $3,418 | $272,610 | $121,567 | $151,043 |
| 2014 | $3,438 | $267,271 | $119,186 | $148,085 |
Source: Public Records
Map
Nearby Homes
- 16951 Knapp St
- 16938 Knapp St
- 16842 Liggett St
- 9434 Mclennan Ave
- 9055 Forbes Ave
- 9218 Gerald Ave
- 9021 Rubio Ave
- 17033 Rayen St
- 16751 Rayen St
- 16600 Nordhoff St
- 8837 Oak Park Ave
- 8901 Rubio Ave
- 16507 Calahan St
- 17158 Citronia St
- 16458 Calahan St
- 17300 Sunburst St
- 17259 Rayen St
- 17409 Nordhoff St
- 8915 Odessa Ave
- 9226 Gothic Ave
- 16944 Tupper St
- 16956 Tupper St
- 16938 Tupper St
- 16957 Knapp St
- 16945 Knapp St
- 16964 Tupper St
- 16939 Knapp St
- 16945 Tupper St
- 16965 Knapp St
- 16930 Tupper St
- 16939 Tupper St
- 16965 Tupper St
- 16931 Knapp St
- 16931 Tupper St
- 16952 Liggett St
- 16944 Liggett St
- 16950 Knapp St
- 16944 Knapp St
- 16956 Knapp St
- 16938 Liggett St